Everything the Personal Digest and the Report Health Digest put in your inbox is also available as JSON. If you want run health in your own dashboards, spreadsheets, or scripts, this page walks through the whole flow: one token, one exchange call, one data call.
Step 1: create a Personal Access Token
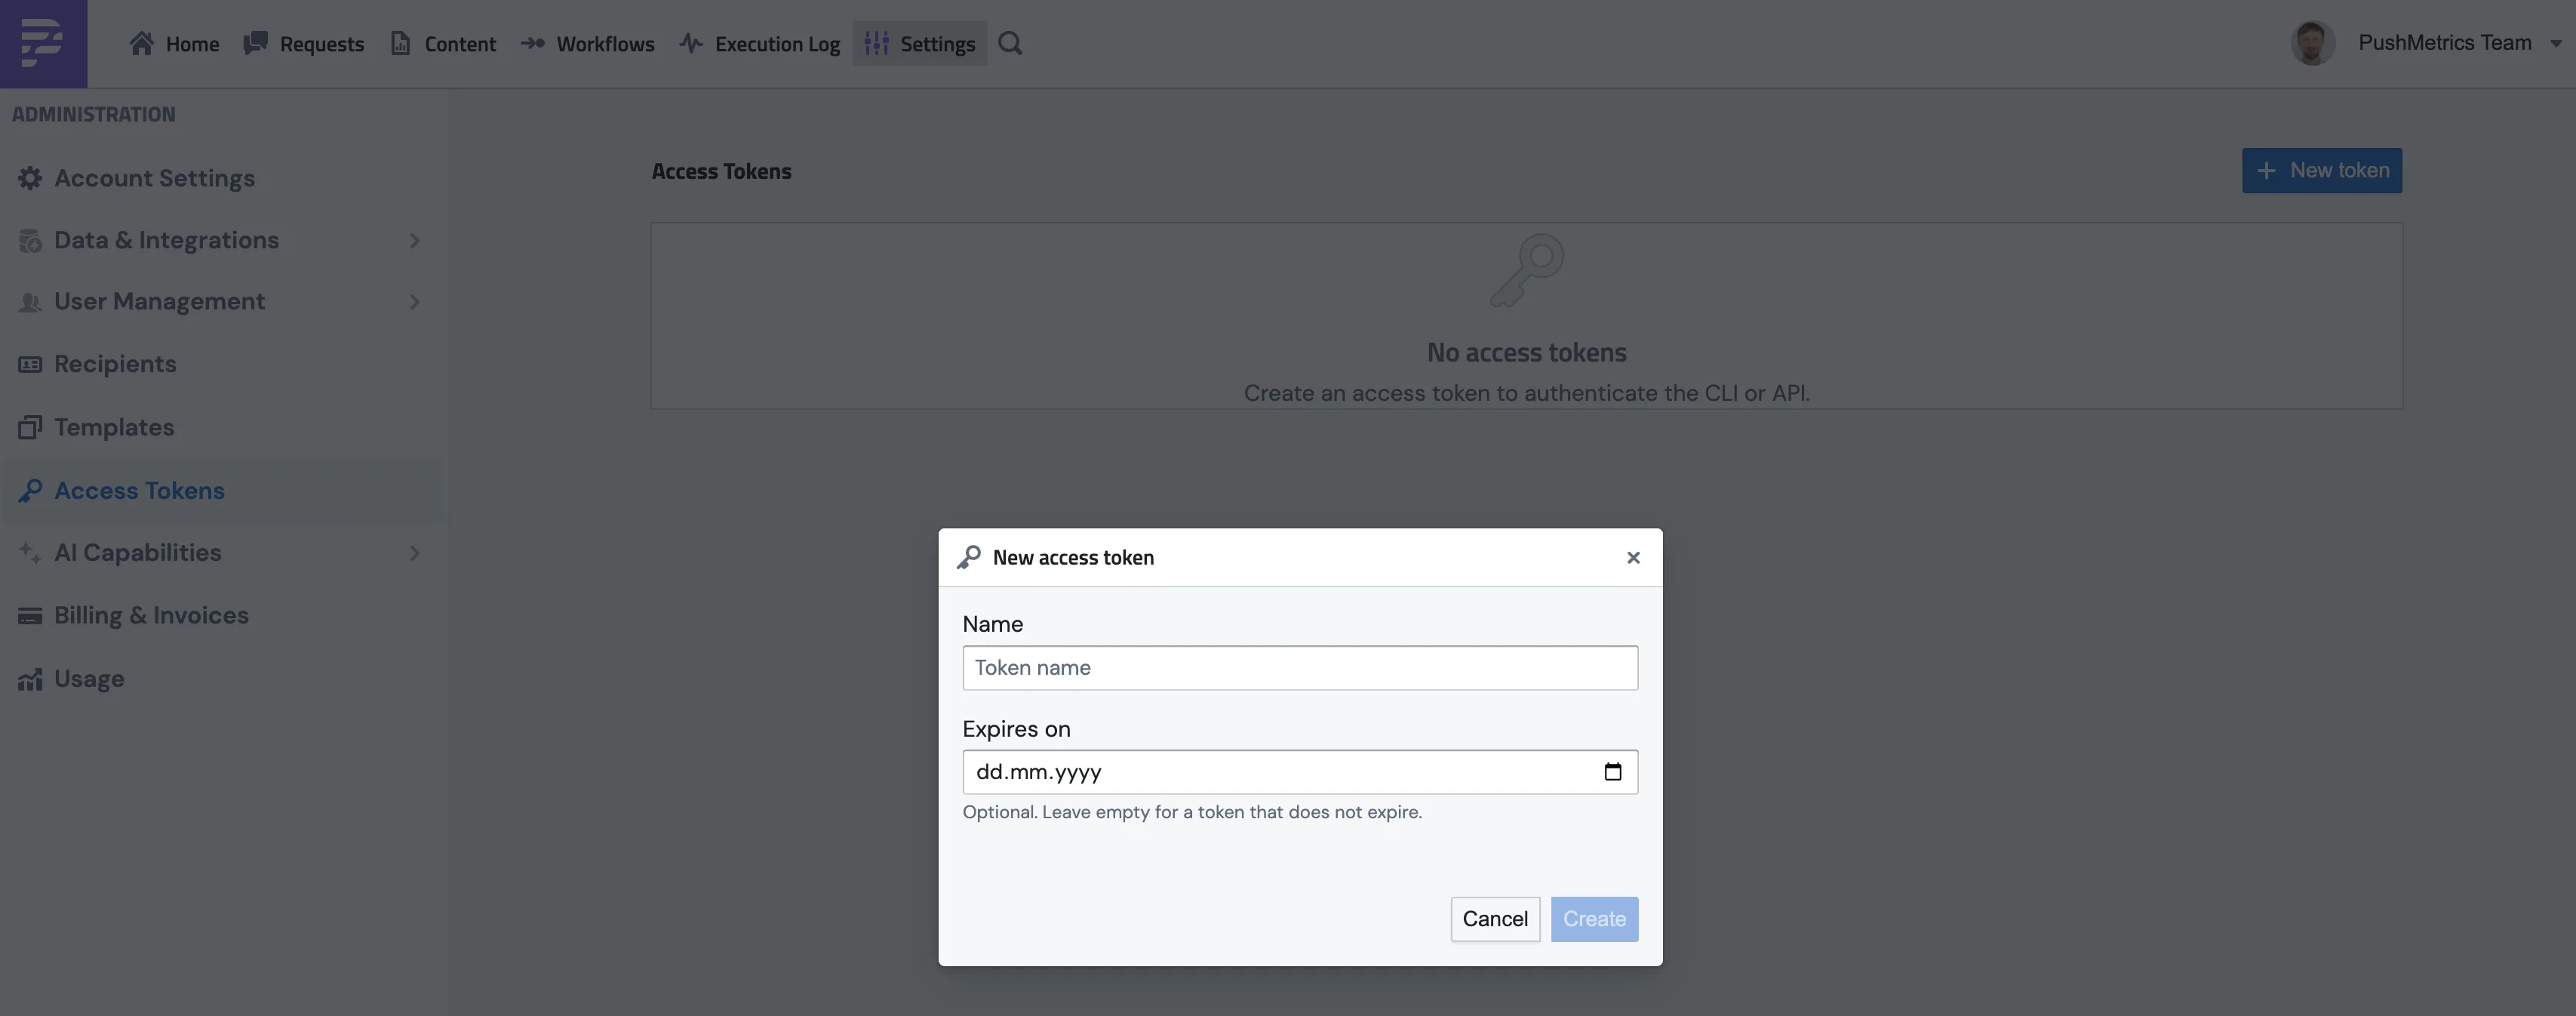
In the app, open Settings and pick Access Tokens (or go straight to /a/tokens). Click New token and give it a name; the expiry date is optional.
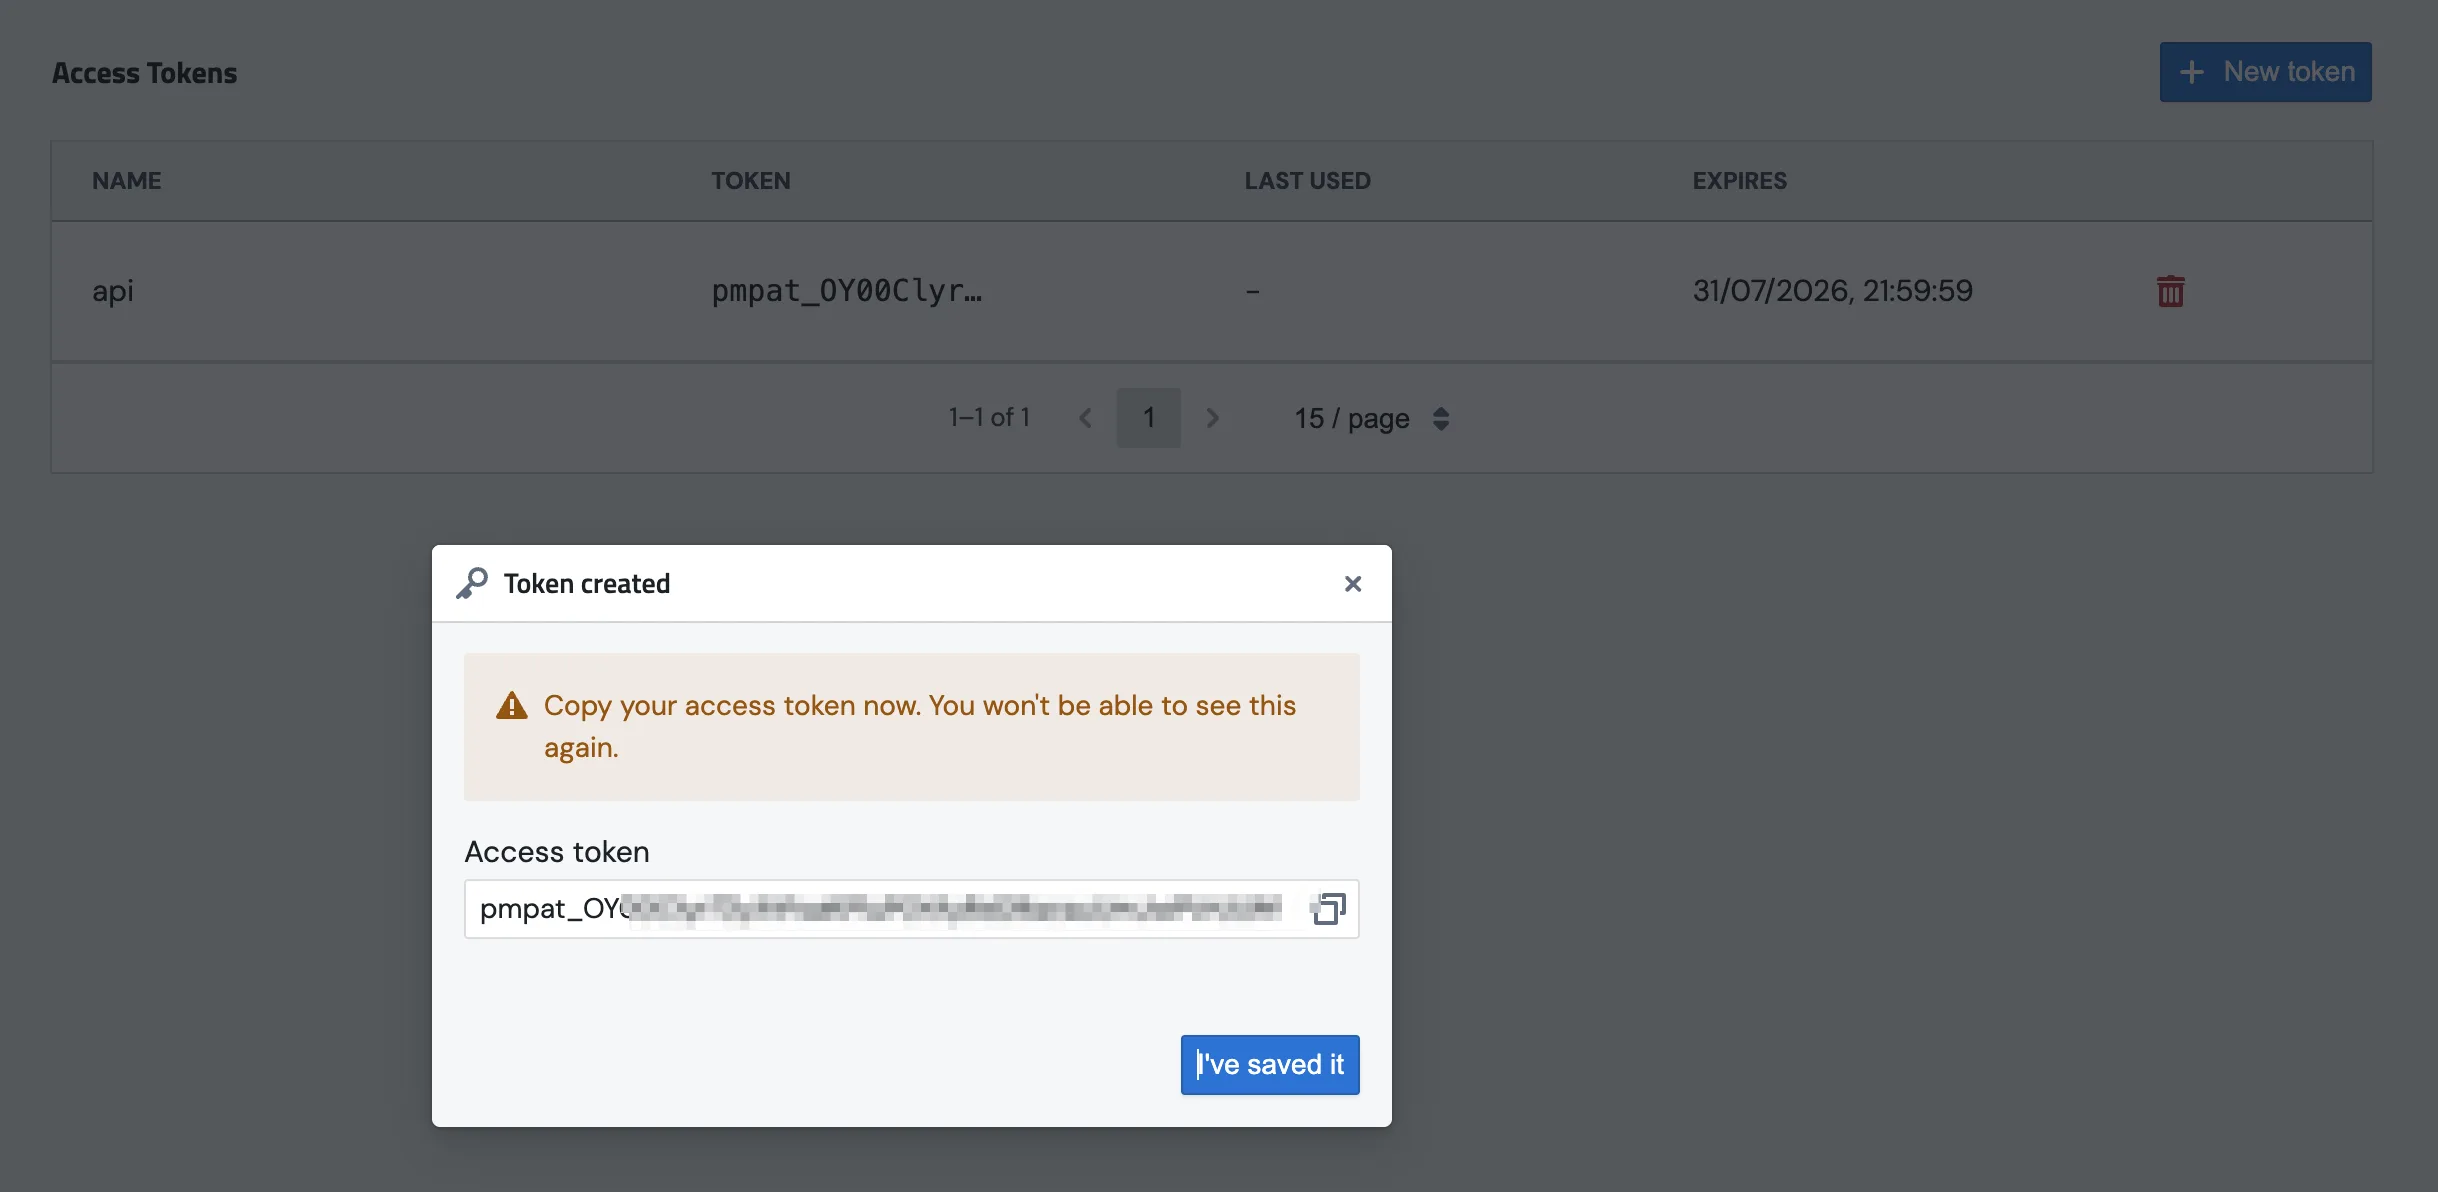
Copy the pmpat_... value from the confirmation dialog — this is the only time it is shown.
Two things to know:
- The token is shown once, at creation. Store it in a secrets manager, not in code.
- The token is bound to the workspace that was active when you created it. It will only ever return data for that workspace. Working in two workspaces means two tokens.
Any member can create a token. You can revoke it any time on the same page.
Step 2: exchange the token for an access key
The pmpat_... token never authenticates API calls directly. You exchange it for a short-lived access key (a JWT, valid for about 15 minutes):
JWT=$(curl -s -X POST https://pushmetrics.io/api/v1/security/exchange \
  -H "Authorization: Bearer pmpat_YOUR_TOKEN" | jq -r .access_token)
Cache the key and reuse it until it expires. The exchange endpoint is rate limited, so a loop that exchanges on every request will start seeing 429 responses. When a data call returns 401, exchange again.
Step 3: fetch the data
Two endpoints, same shape, different scope:
# Your own scheduled items (any member's token)
curl -s "https://pushmetrics.io/api/v1/user_config/personal_digest/data?window_days=7" \
  -H "Authorization: Bearer $JWT"

# Every report in the workspace, with owner names (workspace ADMIN's token only)
curl -s "https://pushmetrics.io/api/v1/workspace_config/report_digest/data?window_days=7" \
  -H "Authorization: Bearer $JWT"
window_days accepts 1 to 90. The personal endpoint defaults to 7; the workspace endpoint defaults to your configured digest cadence. A non-admin calling the workspace endpoint gets a 403, because that payload spans every report in the workspace including who owns them.
What comes back
The personal endpoint returns totals, an items list, and the failing and stopped subsets. The list covers up to 1,000 items; items_overflow reports how many were cut beyond that, so check it if your inventory is very large. Each item carries:
| Field | Meaning |
|---|---|
name, type |
Report name and kind: report, notebook, or agent |
schedule |
Human-readable, like daily or every 10 minutes |
last_run_at |
Full timestamp of the most recent run, or null if it never ran |
runs, successes, failures |
Run counts inside the window |
success_pct |
Success rate over completed runs, null when nothing completed |
avg_duration_s |
Average execution time in seconds |
last_error |
The most recent failure message, on failing items |
url |
Deep link to the report in the app |
The workspace endpoint returns totals, failing, and stopped (no full inventory, mirroring its email), and each entry additionally carries owner. Its totals distinguish reports_ran (produced at least one run in the window) from scheduled_reports (have an active schedule, whether or not they ran). A large gap between the two usually means silently stopped schedules.
Items are ordered problems first, so the top of items is always the part worth reading.
Useful one-liners
# A readable table of everything you have scheduled
curl -s ... | jq -r '.result.items[]
  | [.name, .type, .last_run_at // "never", ((.success_pct // "-") | tostring) + "%",
     ((.avg_duration_s // "-") | tostring) + "s"] | @tsv' | column -t -s$'\t'

# Only what is broken, with the actual error text
curl -s ... | jq '.result.failing[] | {name, last_error}'

# Only what silently stopped running
curl -s ... | jq '.result.stopped[] | {name, schedule, last_run_at}'
A small Python client
import requests

BASE = "https://pushmetrics.io/api/v1"
PAT = "pmpat_..."   # from your secrets store

def get_jwt():
    r = requests.post(f"{BASE}/security/exchange",
                      headers={"Authorization": f"Bearer {PAT}"})
    r.raise_for_status()
    return r.json()["access_token"]

jwt = get_jwt()
r = requests.get(f"{BASE}/user_config/personal_digest/data",
                 params={"window_days": 7},
                 headers={"Authorization": f"Bearer {jwt}"})
if r.status_code == 401:   # key expired mid-job, get a fresh one
    jwt = get_jwt()
    r = requests.get(f"{BASE}/user_config/personal_digest/data",
                     params={"window_days": 7},
                     headers={"Authorization": f"Bearer {jwt}"})
r.raise_for_status()

data = r.json()["result"]
print(f"{data['totals']['items']} items, {data['totals']['success_pct']}% success")
for item in data["failing"]:
    print(f"FAILING {item['name']}: {item['last_error']}")
Good practices
- Poll at digest cadence. The data is a rollup over a window; once or twice a day is the right frequency. There is nothing to gain from minute-level polling.
- Treat the responses as the digests' source of truth. The emails, the API, and the numbers your admin sees are computed by the same code, so they never disagree.
- Revoke tokens you stop using on the Access Tokens page. Access keys minted from a revoked token die within 15 minutes.
Related
- Run History API, when you want each individual execution — timestamp, status, duration, error — instead of rollups.
- Reports API, the inventory of the reports themselves — schedule, destinations, formats, and full YAML configuration.
- Personal Digest, the email these numbers come from.
- Report Health Digest, the workspace-wide admin version.