Want a clear picture of everything that's going out? Which reports are active, who's receiving them, and whether they're running smoothly? It's a reasonable thing to ask for, and here's how to get it today.
Exporting your reports and recipients
You can export your report metadata to YAML right from the app. Select the reports you want from the report list, then use the export action to download a ZIP file with one YAML file per report. Each YAML captures the report's configuration, its schedule, and its recipients (including any Slack recipients), so you get a clean, readable record of what each report sends and to whom.
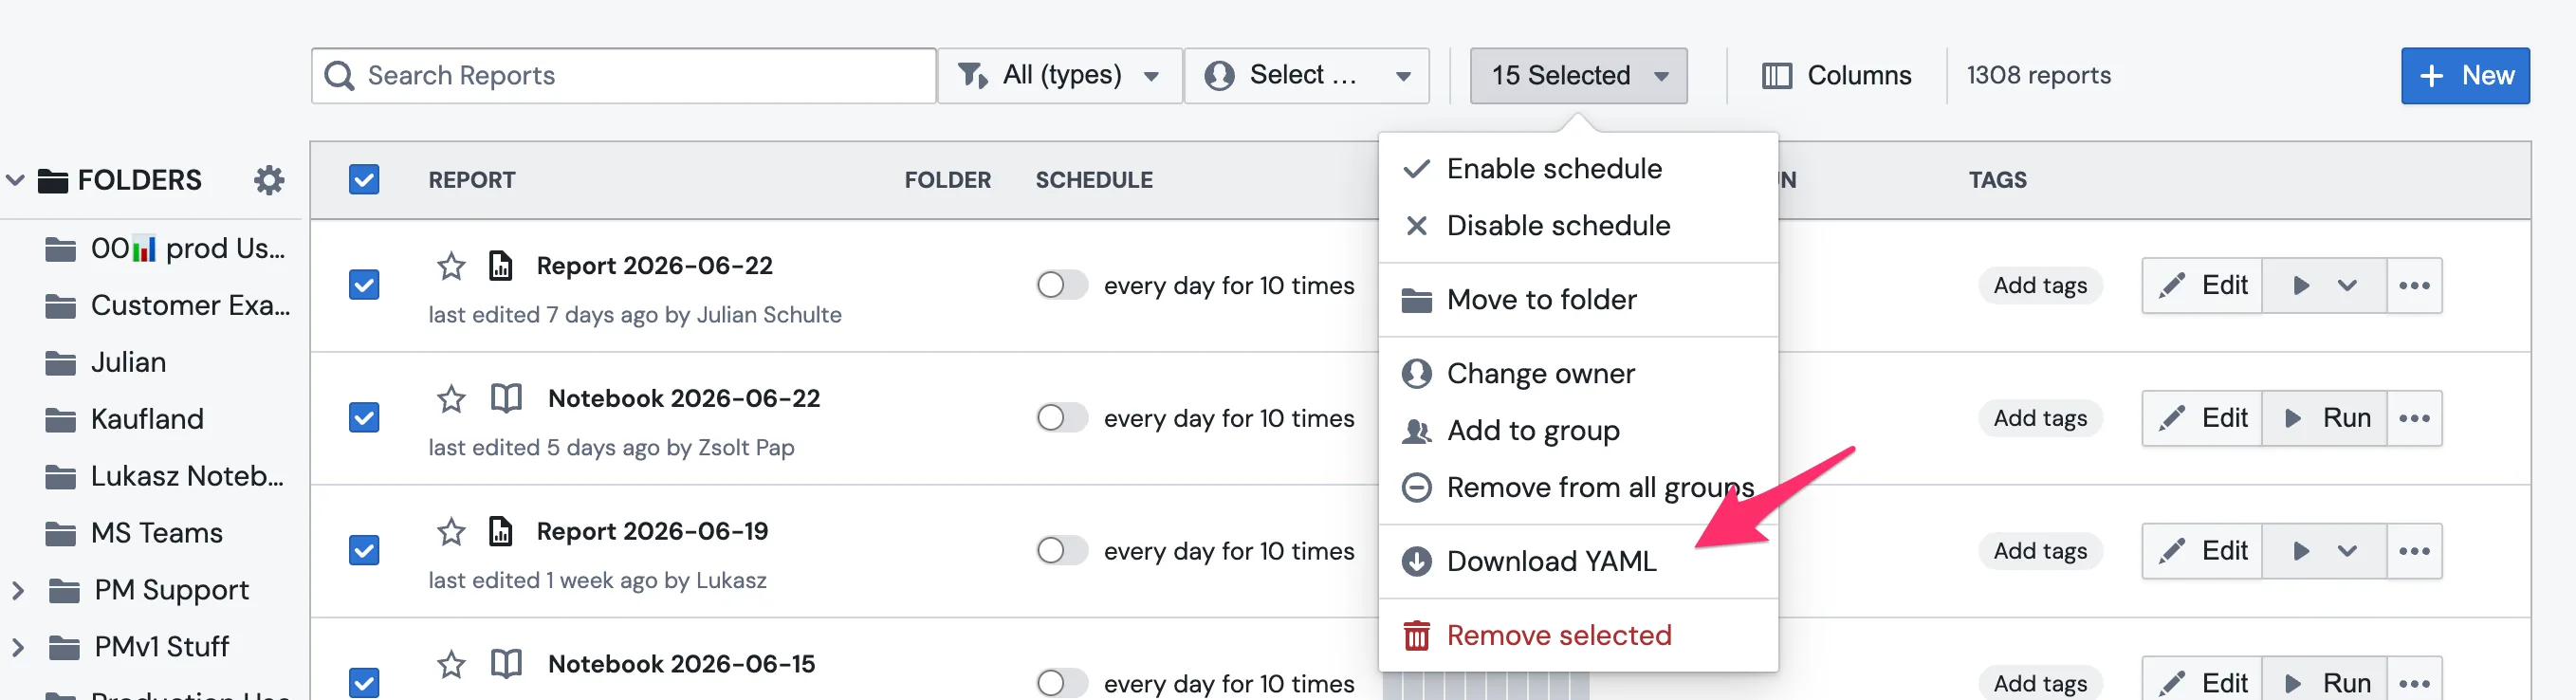
This is handy when you want to audit your distribution lists, review what's scheduled, or keep a versioned copy of a report's setup in your own repo. Since it's plain YAML, it's easy to search, diff, or hand off to a teammate.
Exporting recipients to CSV
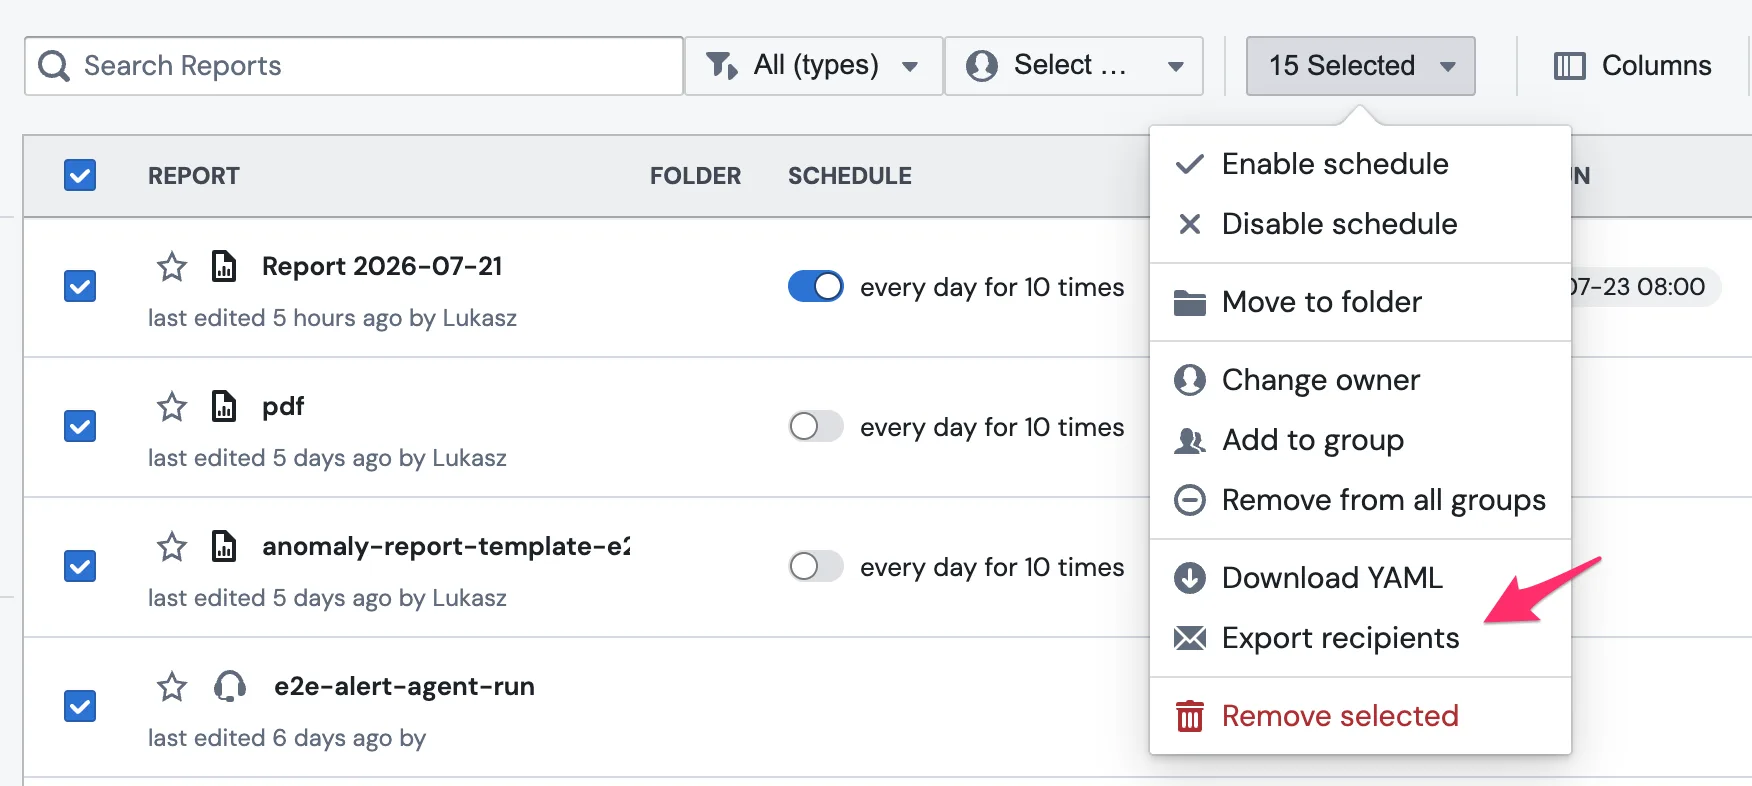
If what you actually want is the distribution list itself, meaning "who receives what, and where" as a spreadsheet, there's a faster path than reading YAML. Select reports in the report list (up to 200 at a time), open the bulk actions menu, and choose Export recipients. You get a CSV with one row per recipient or destination, covering every destination type:
- Email: one row per address, split by to/cc/bcc, with display names parsed out. Dynamic distribution lists written as template expressions (
{{ ... }}) are kept as-is in their own row, so they stay visible instead of silently disappearing. - Slack: one row per channel.
- Webhooks: the target URL.
- SFTP, Amazon S3, Google Cloud Storage, Azure Blob, Google Drive: the path or key, together with the name of the integration it uploads through.
Each row also carries the report's name, the block it came from, and the destination type, so the file drops straight into a pivot table or a compliance review.
Checking whether runs are succeeding
For a run-by-run view, the Execution Log inside the app is your friend. It shows what fired, when it ran, and whether each run succeeded or failed.
One detail that occasionally surprises people: scheduled runs are now logged under the report's creator, not whoever last edited it. So if you see runs attributed to you, that's usually why.
Runs that were intentionally halted by a report's Condition Check show up here too: they finish as successful, marked with a "Stopped by condition check — the report was not sent" tag. You can also have PushMetrics notify you by email or Slack whenever the check stops a report.
Getting notified when a run fails
You don't have to watch the Execution Log to catch failures. PushMetrics can alert you the moment a scheduled run fails.
Open the report, edit its Schedule, and look for Send notification after scheduled run in the trigger settings. There you can:
- Turn on Error Notifications to be notified whenever a run fails. (There's a separate Success Notifications toggle if you also want confirmation that a run went out.)
- Add Email Recipients: any email addresses that should receive the alert.
- Add Slack Recipients: pick a Slack integration and channel to post the alert to (requires the Slack integration).
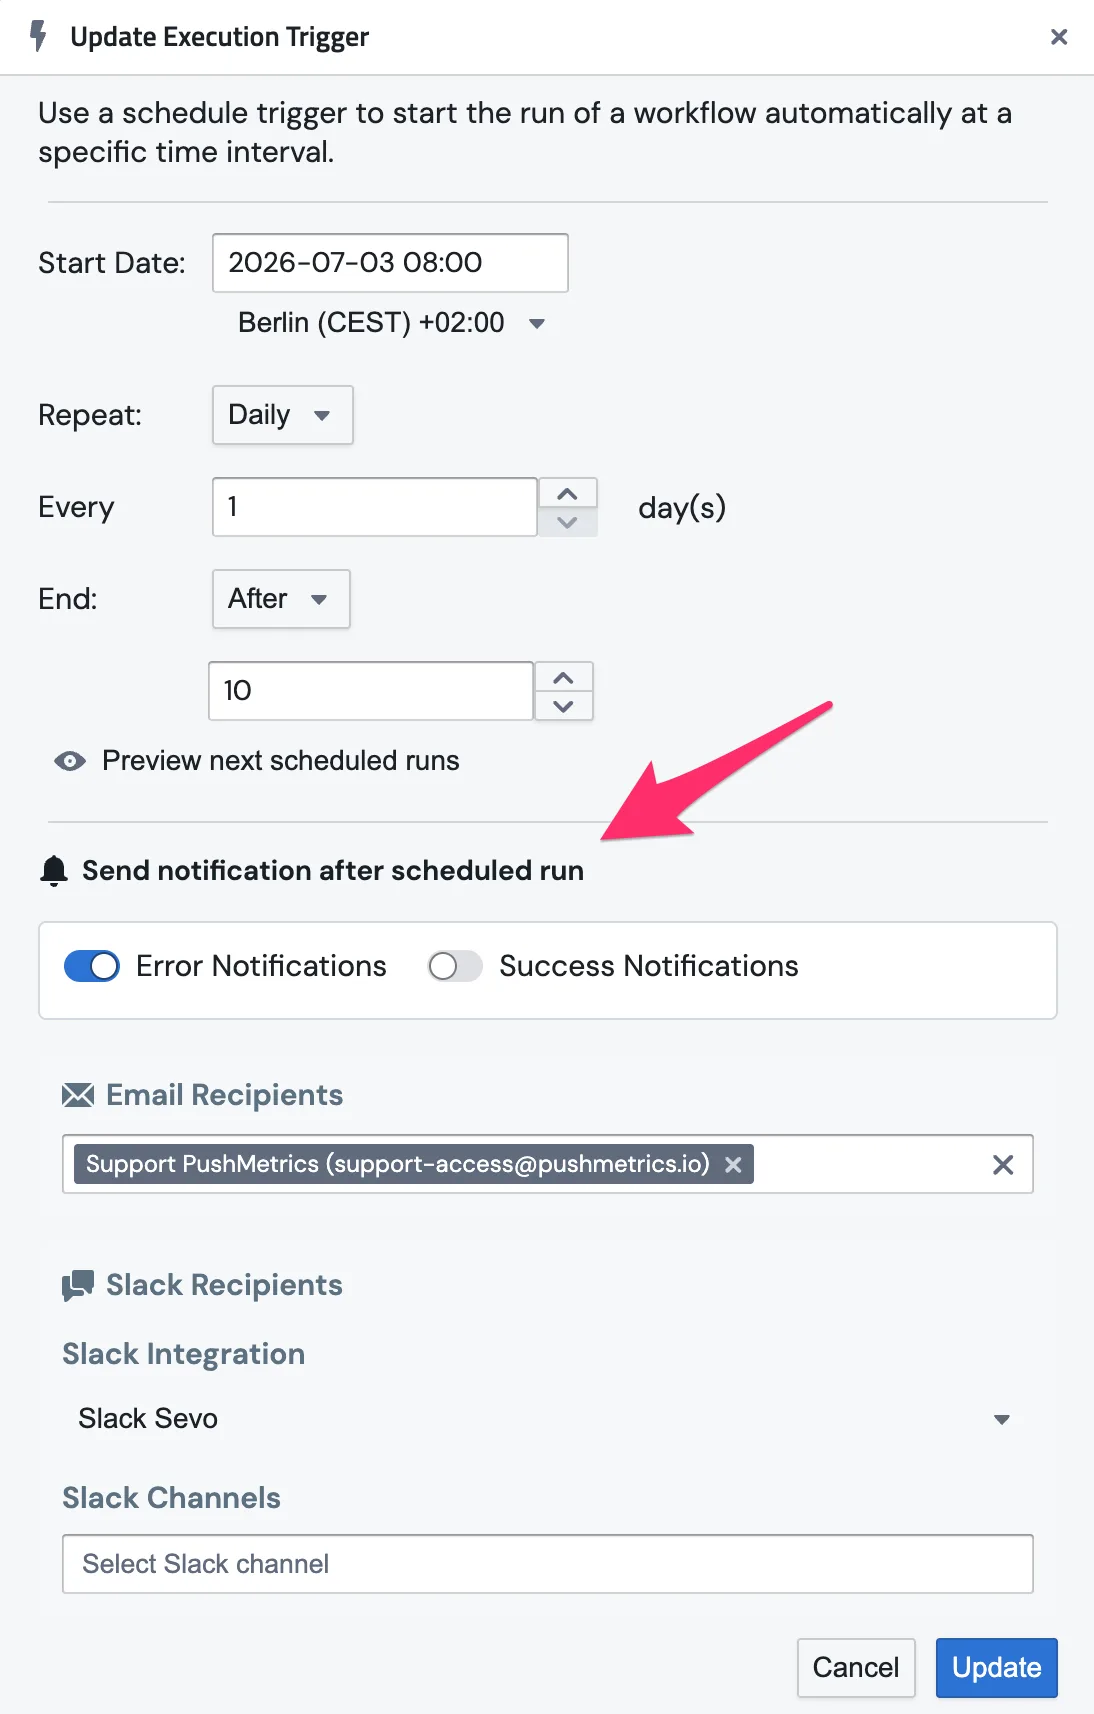
Webhook-triggered runs have the same options on the webhook trigger.
Getting a recurring health summary
The roll-up view people kept asking for is here. The Report Health Digest is a daily or weekly email that summarizes run health across all your reports: which ones are failing (ranked by success rate, with the last failure reason), which ones silently stopped running, and which ones are clean. Workspace admins can enable it in Account Settings, pick a send time in the workspace's timezone, and preview the email before turning it on.
On the roadmap
- A public API for pulling this data programmatically. That one isn't ready yet, but if you've got a use case in mind, tell us about it. That kind of feedback genuinely shapes what we build next.