An Agent Step is a block you drop into a report or notebook that runs an agent partway through the run. The blocks above pull the data, the agent reads it and writes something back (a summary, a verdict, a recommendation), and the blocks below take whatever the agent wrote and deliver it, usually as a Slack message or an email.
Think of it as the bridge between a normal scheduled report and a chat with an agent. The schedule still fires, the SQL still runs, the destination still goes out. Somewhere in the middle, an agent gets to look at the result and respond to it.
When to reach for one
Reach for an Agent Step when the report needs a judgment call you don't want to hard-code. A few examples that come up a lot:
Summarising yesterday's numbers in plain English before the Slack post. Investigating an anomaly the SQL above just surfaced and writing up what happened. Categorising free-text feedback into a structured field so the destination block can branch on it. Drafting an email whose tone changes depending on whether the metric is up or down.
If all you need is a templated string with numbers in it, use a normal template. It's cheaper and faster. Reach for an Agent Step when the wording, structure, or conclusion has to depend on the data.
Building one, end to end
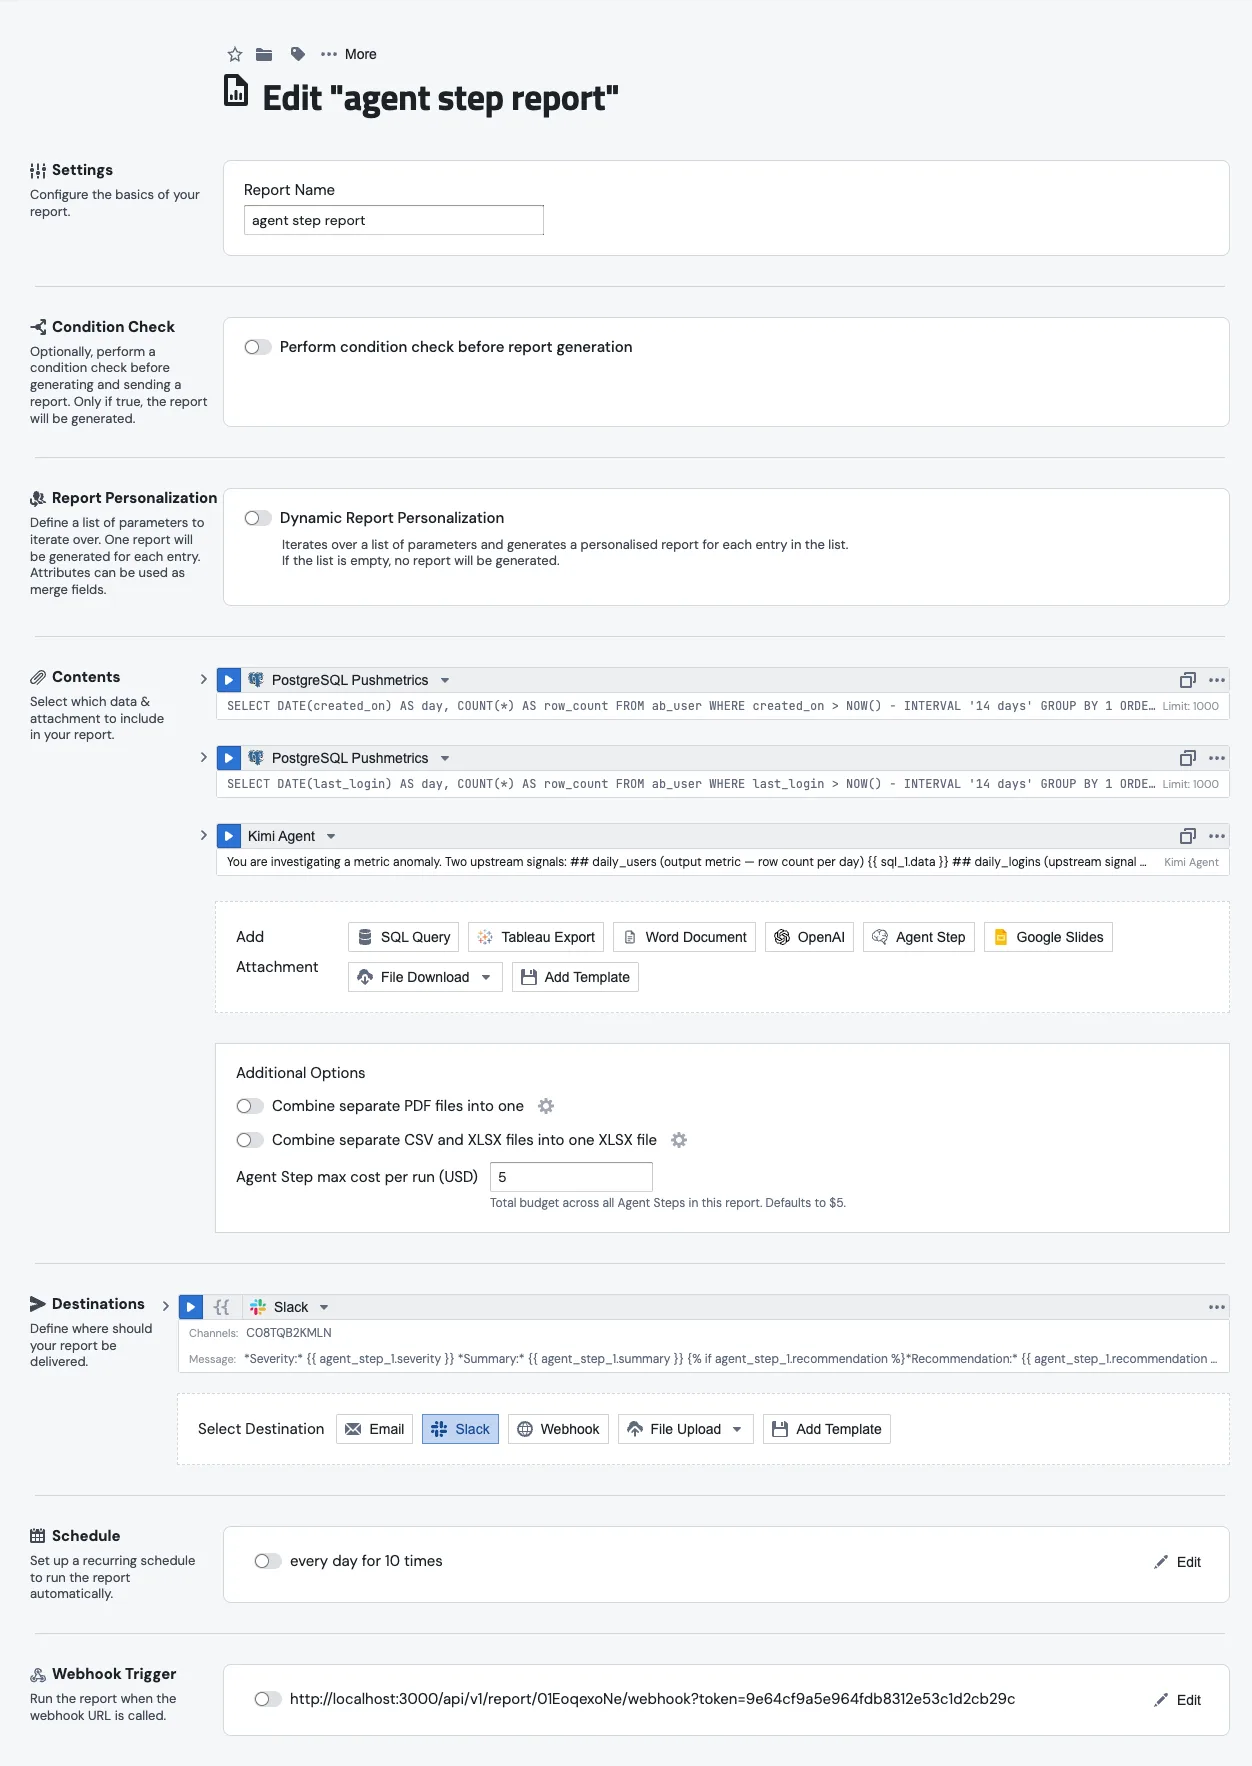
The rest of this page walks through the report shown in the screenshots: an anomaly investigation that pulls two daily metrics, asks an agent to figure out what happened, and posts the verdict to Slack.
1. Add the SQL above
Start with two SQL blocks, sql_1 and sql_2. The first pulls daily users for the last two weeks, the second pulls daily logins. Nothing special about either one. The agent will read them later as {{ sql_1.data }} and {{ sql_2.data }}.
2. Add the Agent Step
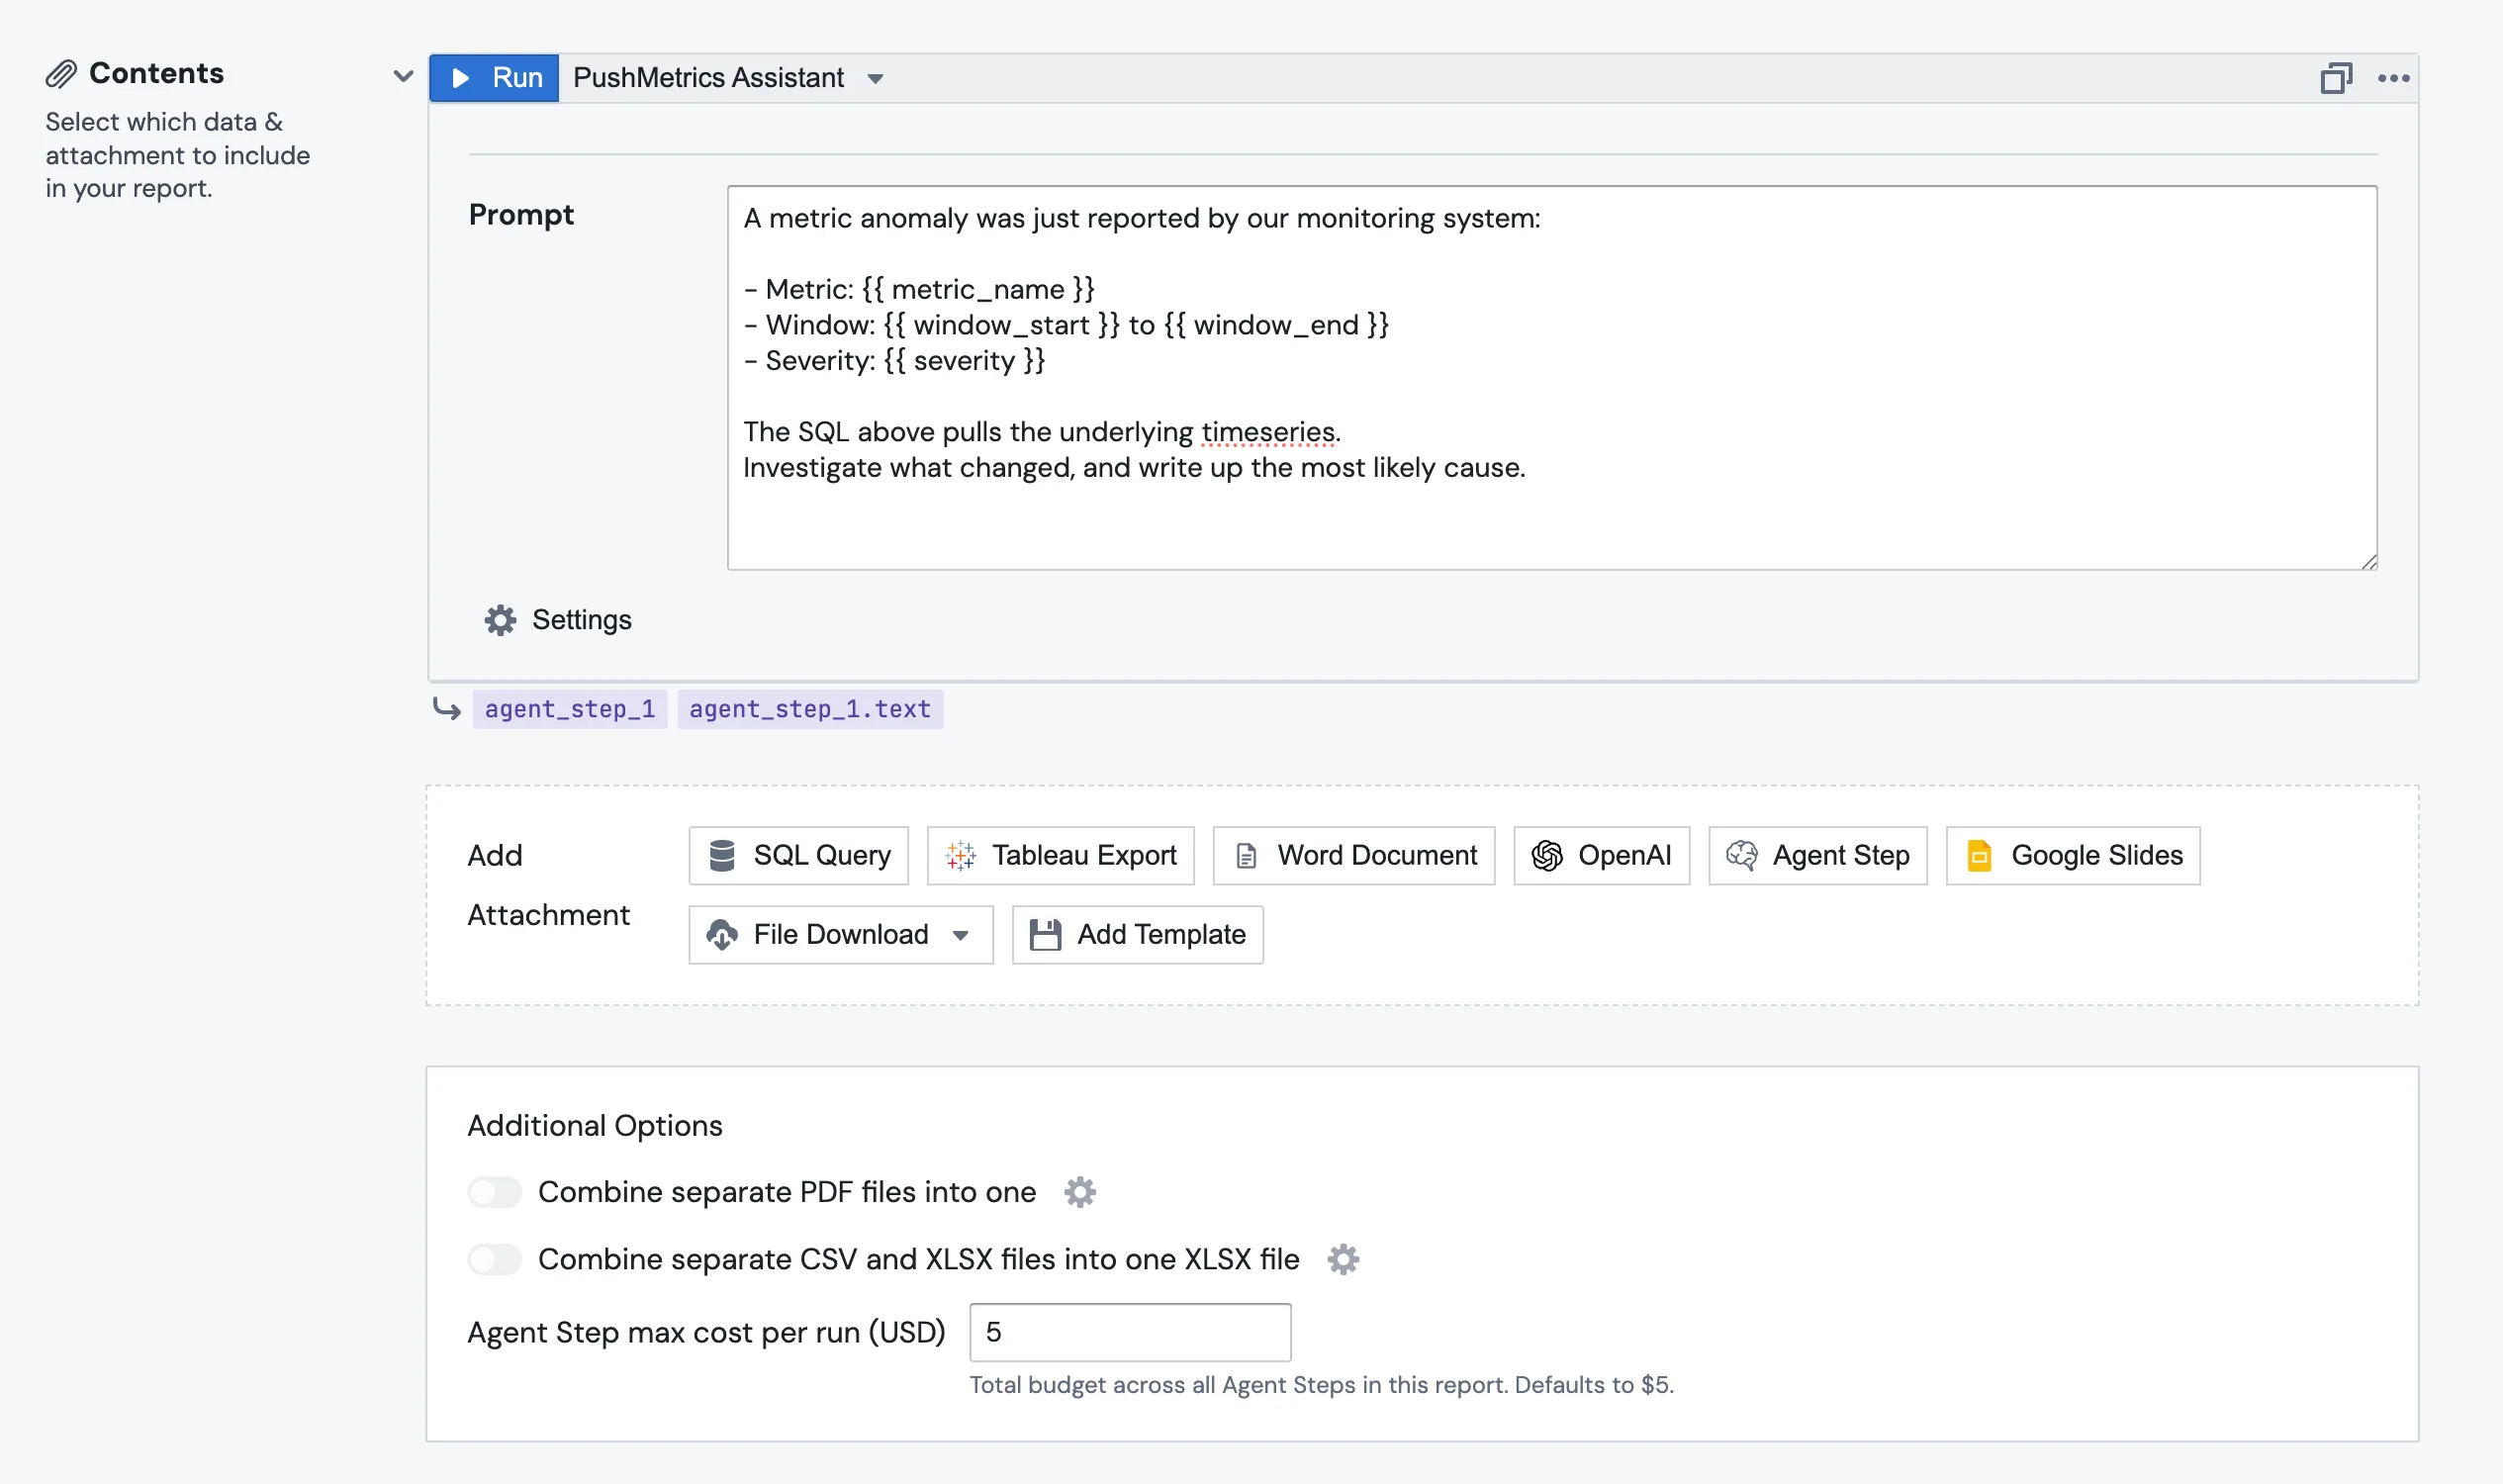
In the Contents section of the report, click Add Attachment and pick Agent Step from the row of attachment types alongside SQL Query, Tableau Export, OpenAI, and the rest.
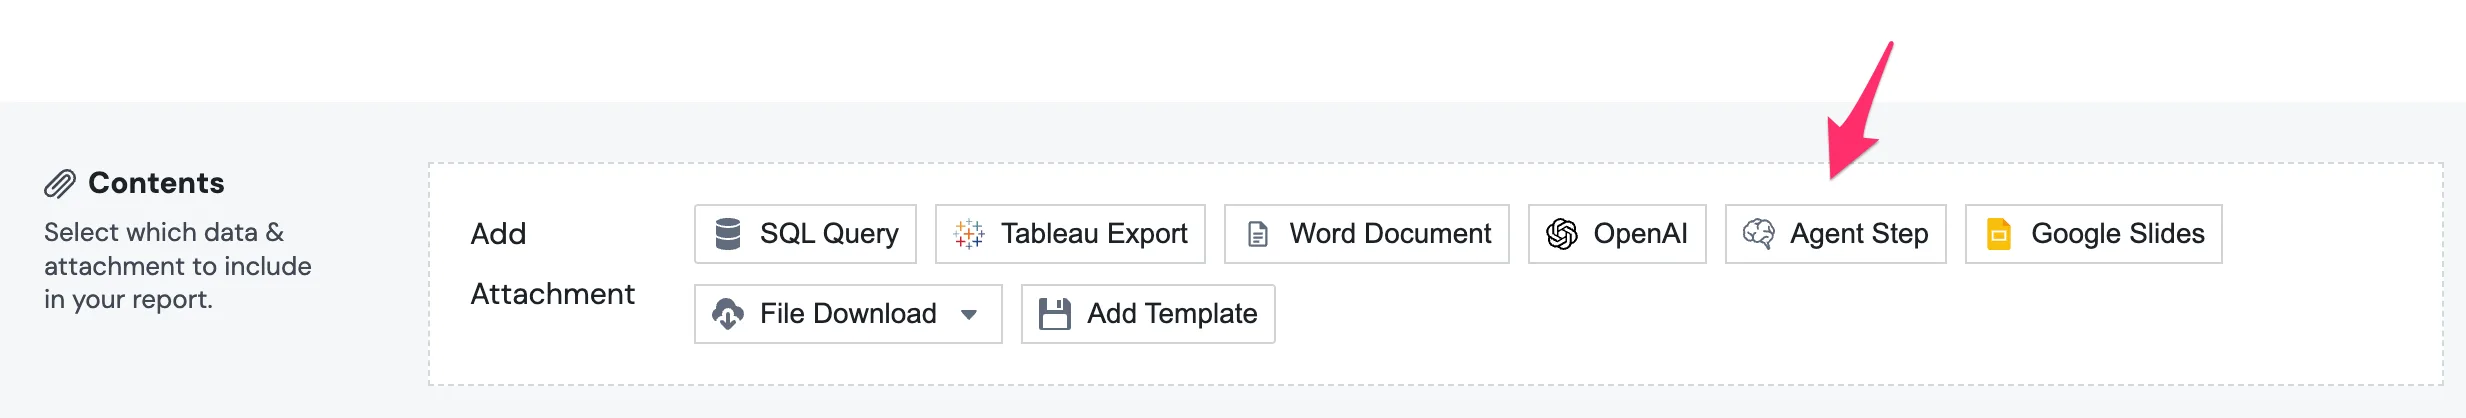
The block lands as agent_step_1, auto-numbered the same way SQL blocks are. Pick the agent in the dropdown next to the Run button. Only active agents show up.
3. Write the prompt
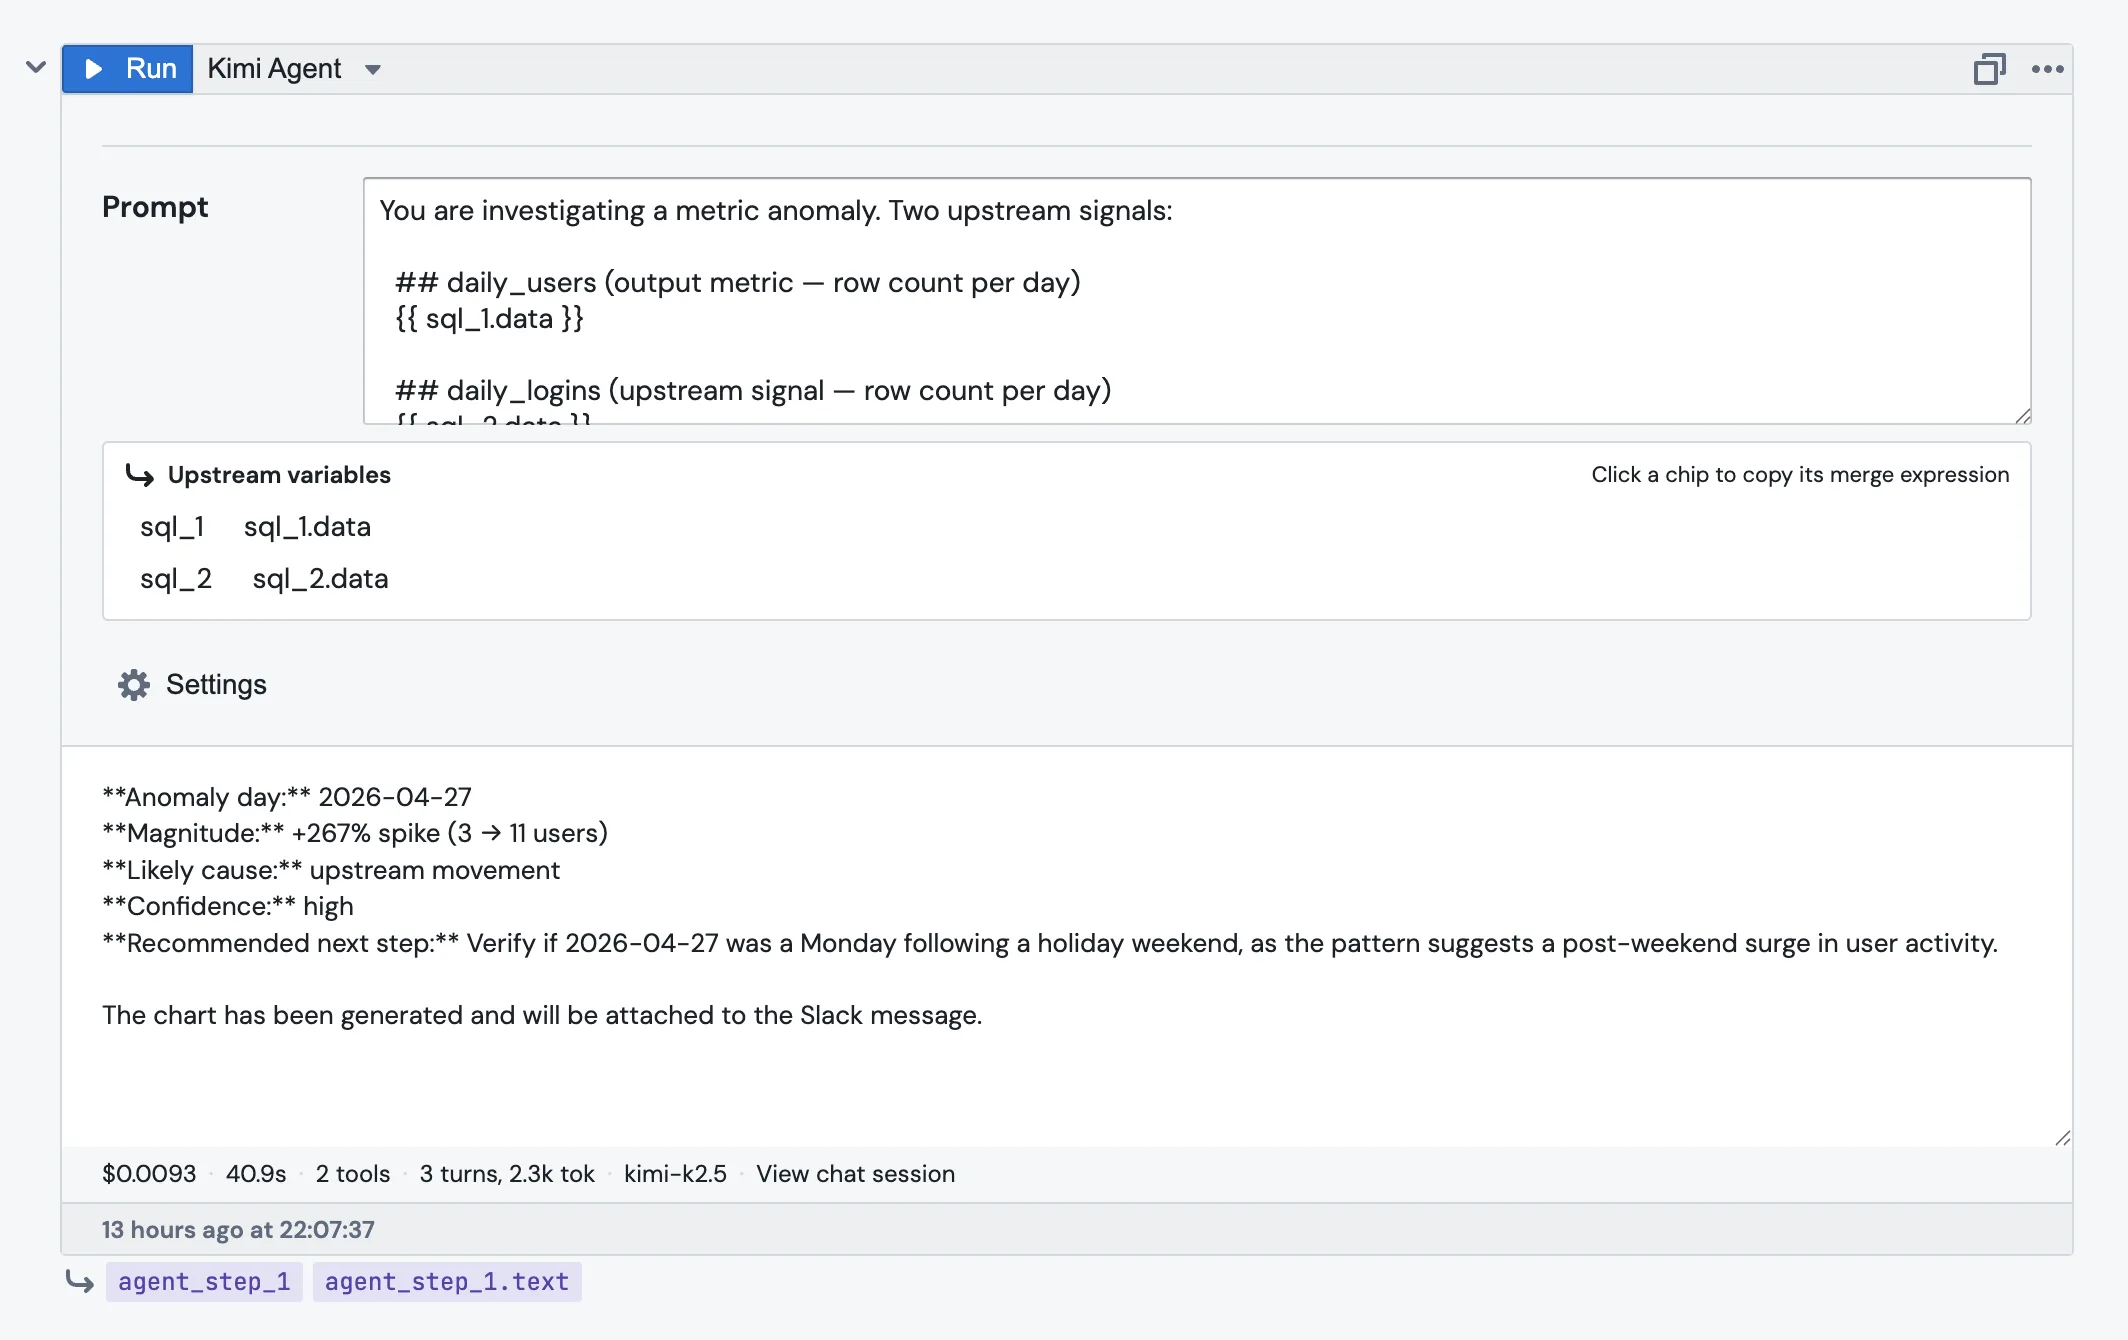
The prompt is Jinja-templated, so you reference upstream blocks the same way you do anywhere else in PushMetrics:
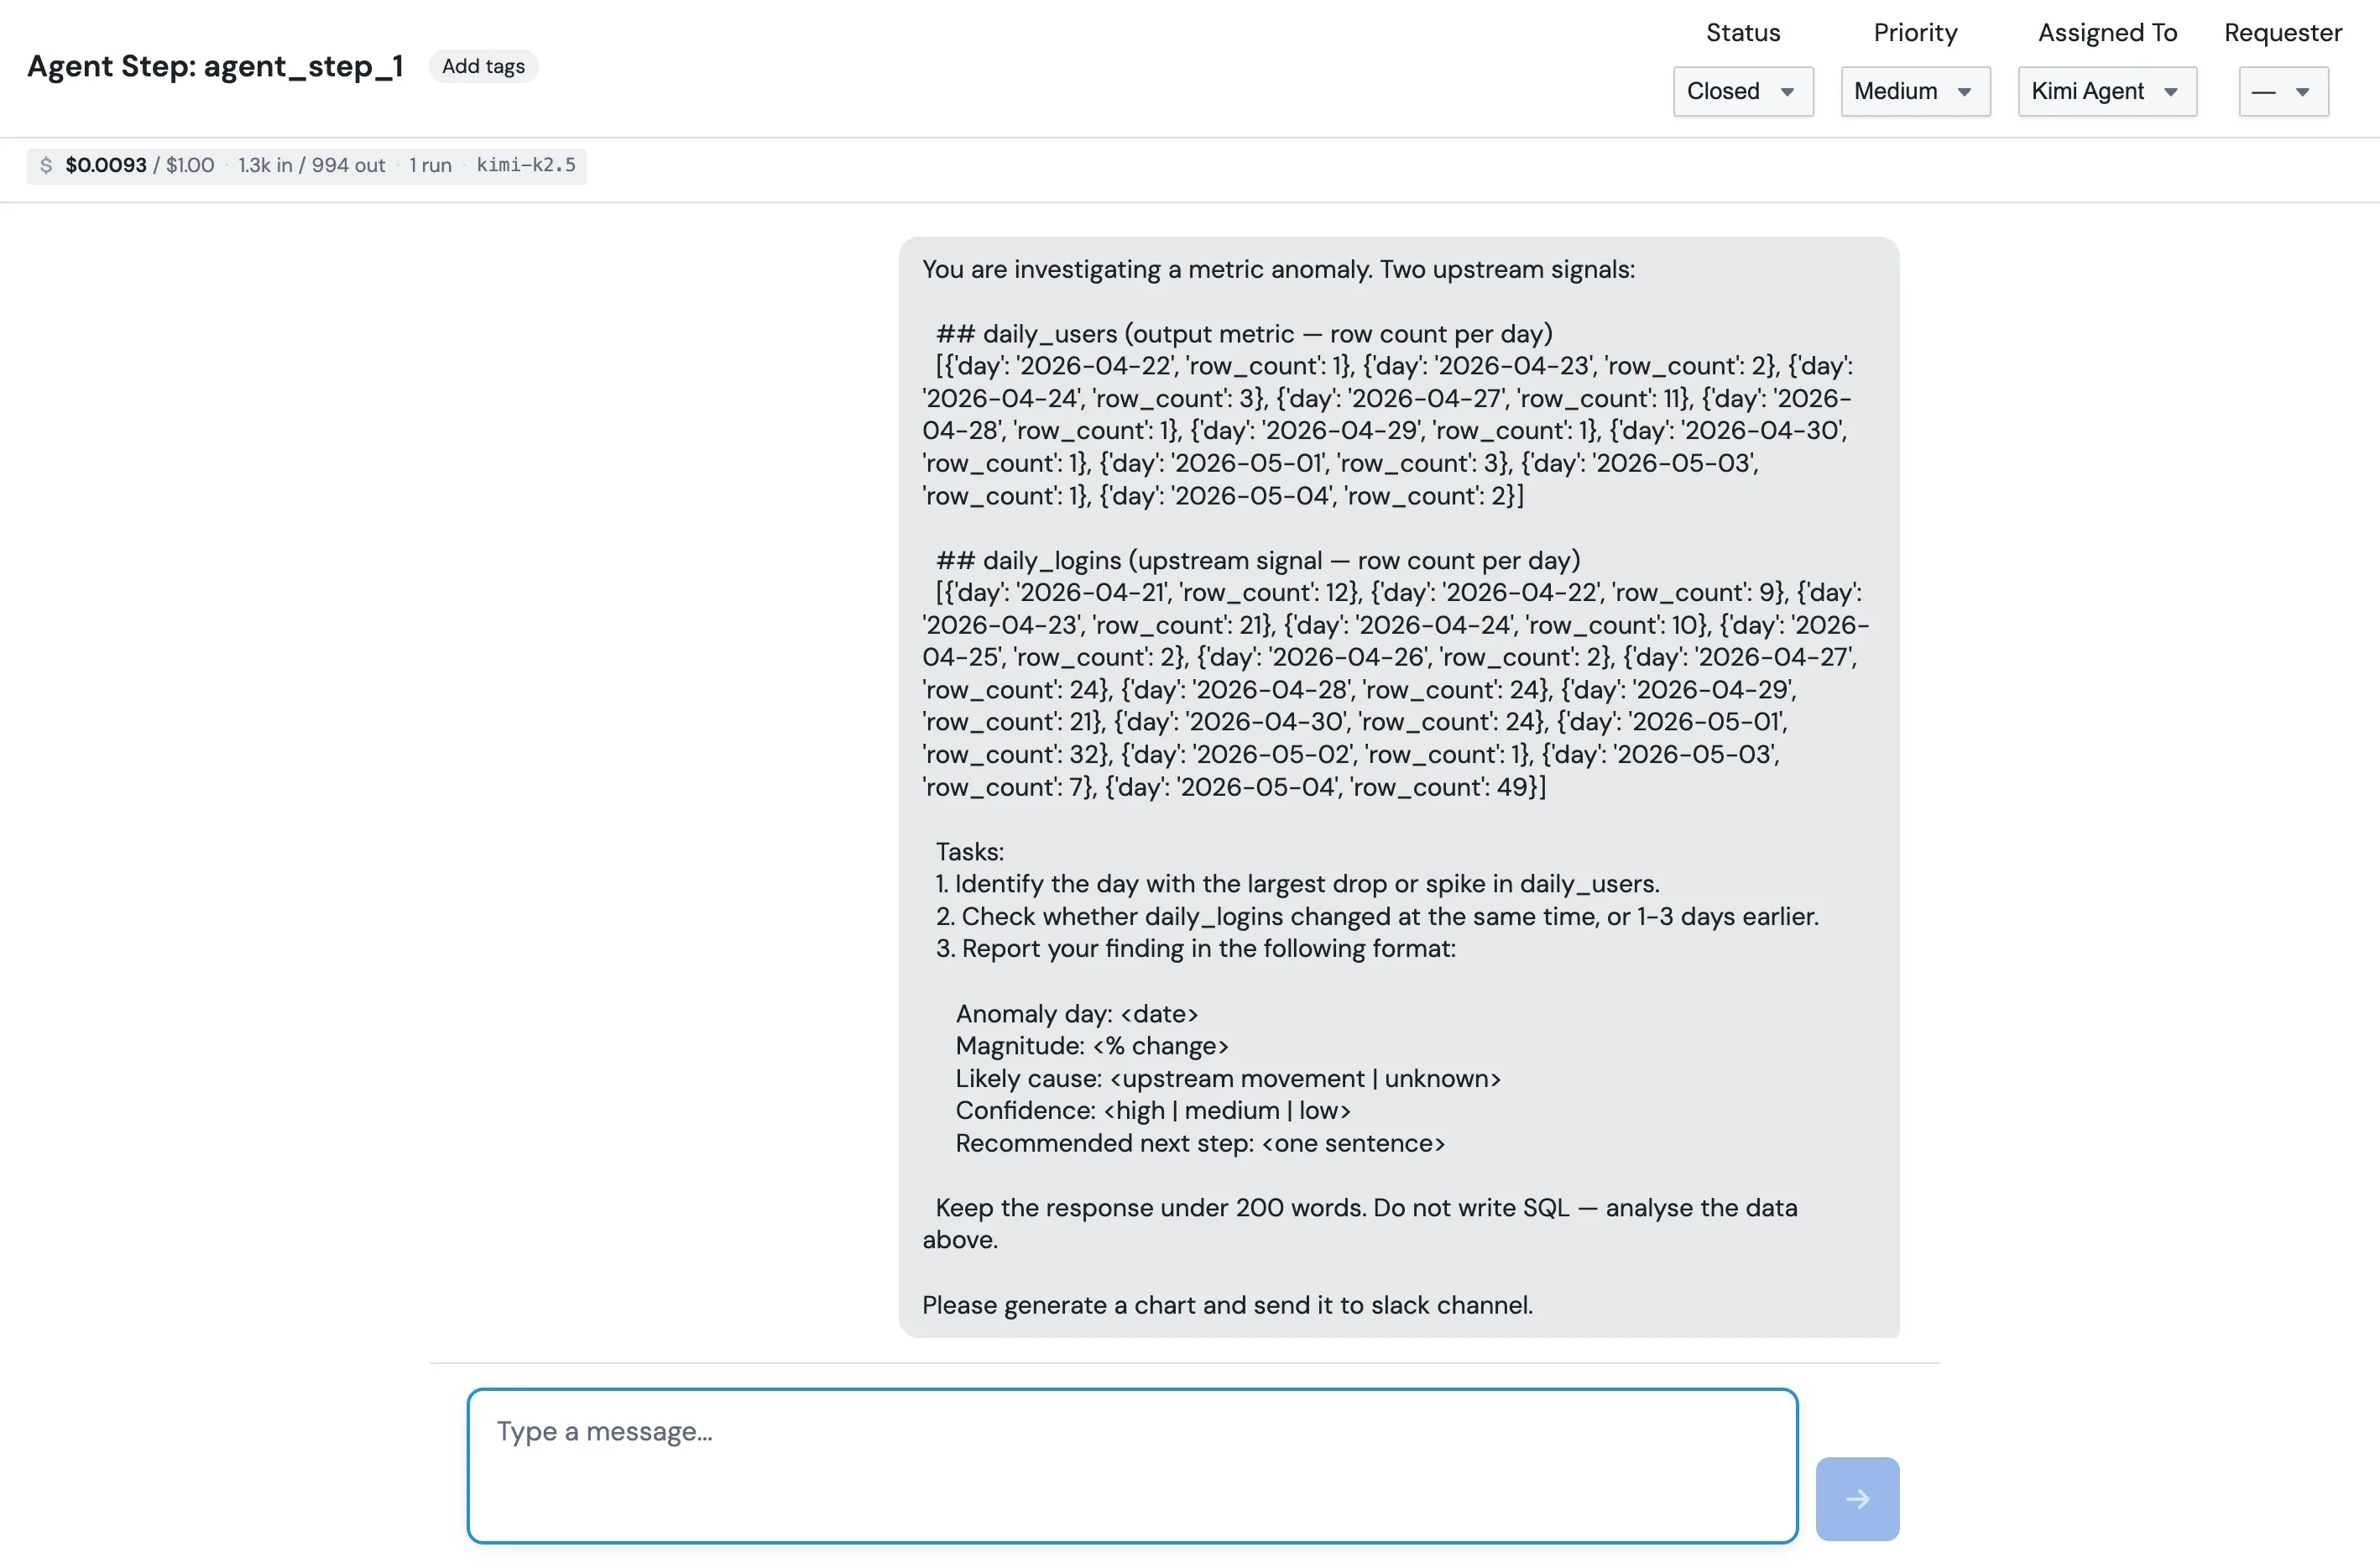
You are investigating a metric anomaly. Two upstream signals:

## daily_users (output metric — row count per day)
{{ sql_1.data }}

## daily_logins (upstream signal — row count per day)
{{ sql_2.data }}

Tasks:
1. Identify the day with the largest drop or spike in daily_users.
2. Check whether daily_logins changed at the same time, or 1–3 days earlier.
3. Report your finding in the format below.
The Upstream variables strip just under the prompt lists every block above this one. Click a chip and the merge expression gets copied to your clipboard. It's handy when you can't remember whether it was sql_1.data or sql_1.result.
4. Set the budget and timeout
Open the Settings section below the prompt. There are three things worth touching:
Max cost (USD) defaults to 1. The step is killed if the agent's tokens and tool calls go past it.
Timeout (s) defaults to 300. The step is killed if the agent takes longer than that.
On failure decides what should happen if the agent errors out, times out, or blows the budget. More on that below.
5. Decide what should happen on failure
Three options in the dropdown.
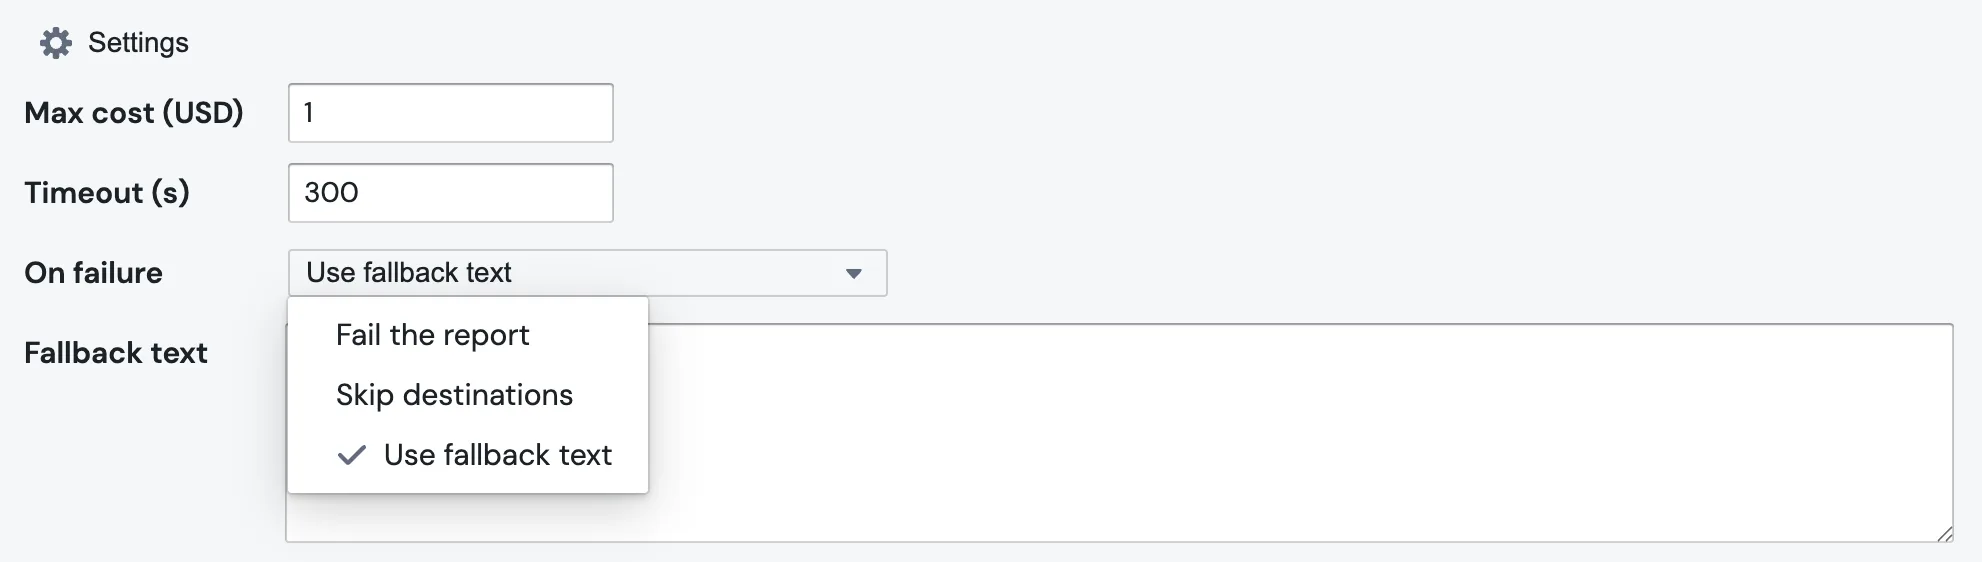
Fail the report stops the whole run. Pick this when the destination block downstream genuinely needs the agent's output.
Skip destinations keeps the run going but marks the destination blocks as skipped. Useful when the alert is "only send if there's something to say".
Use fallback text substitutes a fixed string into {{ agent_step_1.text }} and continues. Reasonable for a daily digest where "no commentary today" is acceptable. Picking this option reveals a Fallback text field for the string you want to use.
Note: budget-cap failures always fail the report, even if you've picked "Skip destinations" or "Use fallback text". This is deliberate. Silently swapping in fallback text after you've blown the budget would hide a runaway spend until the invoice arrives.
6. Add structured output (optional, but worth it)
If a downstream block needs to branch on something ("only send the alert if severity is high"), define an Output schema. Each row is one field the agent must fill in.
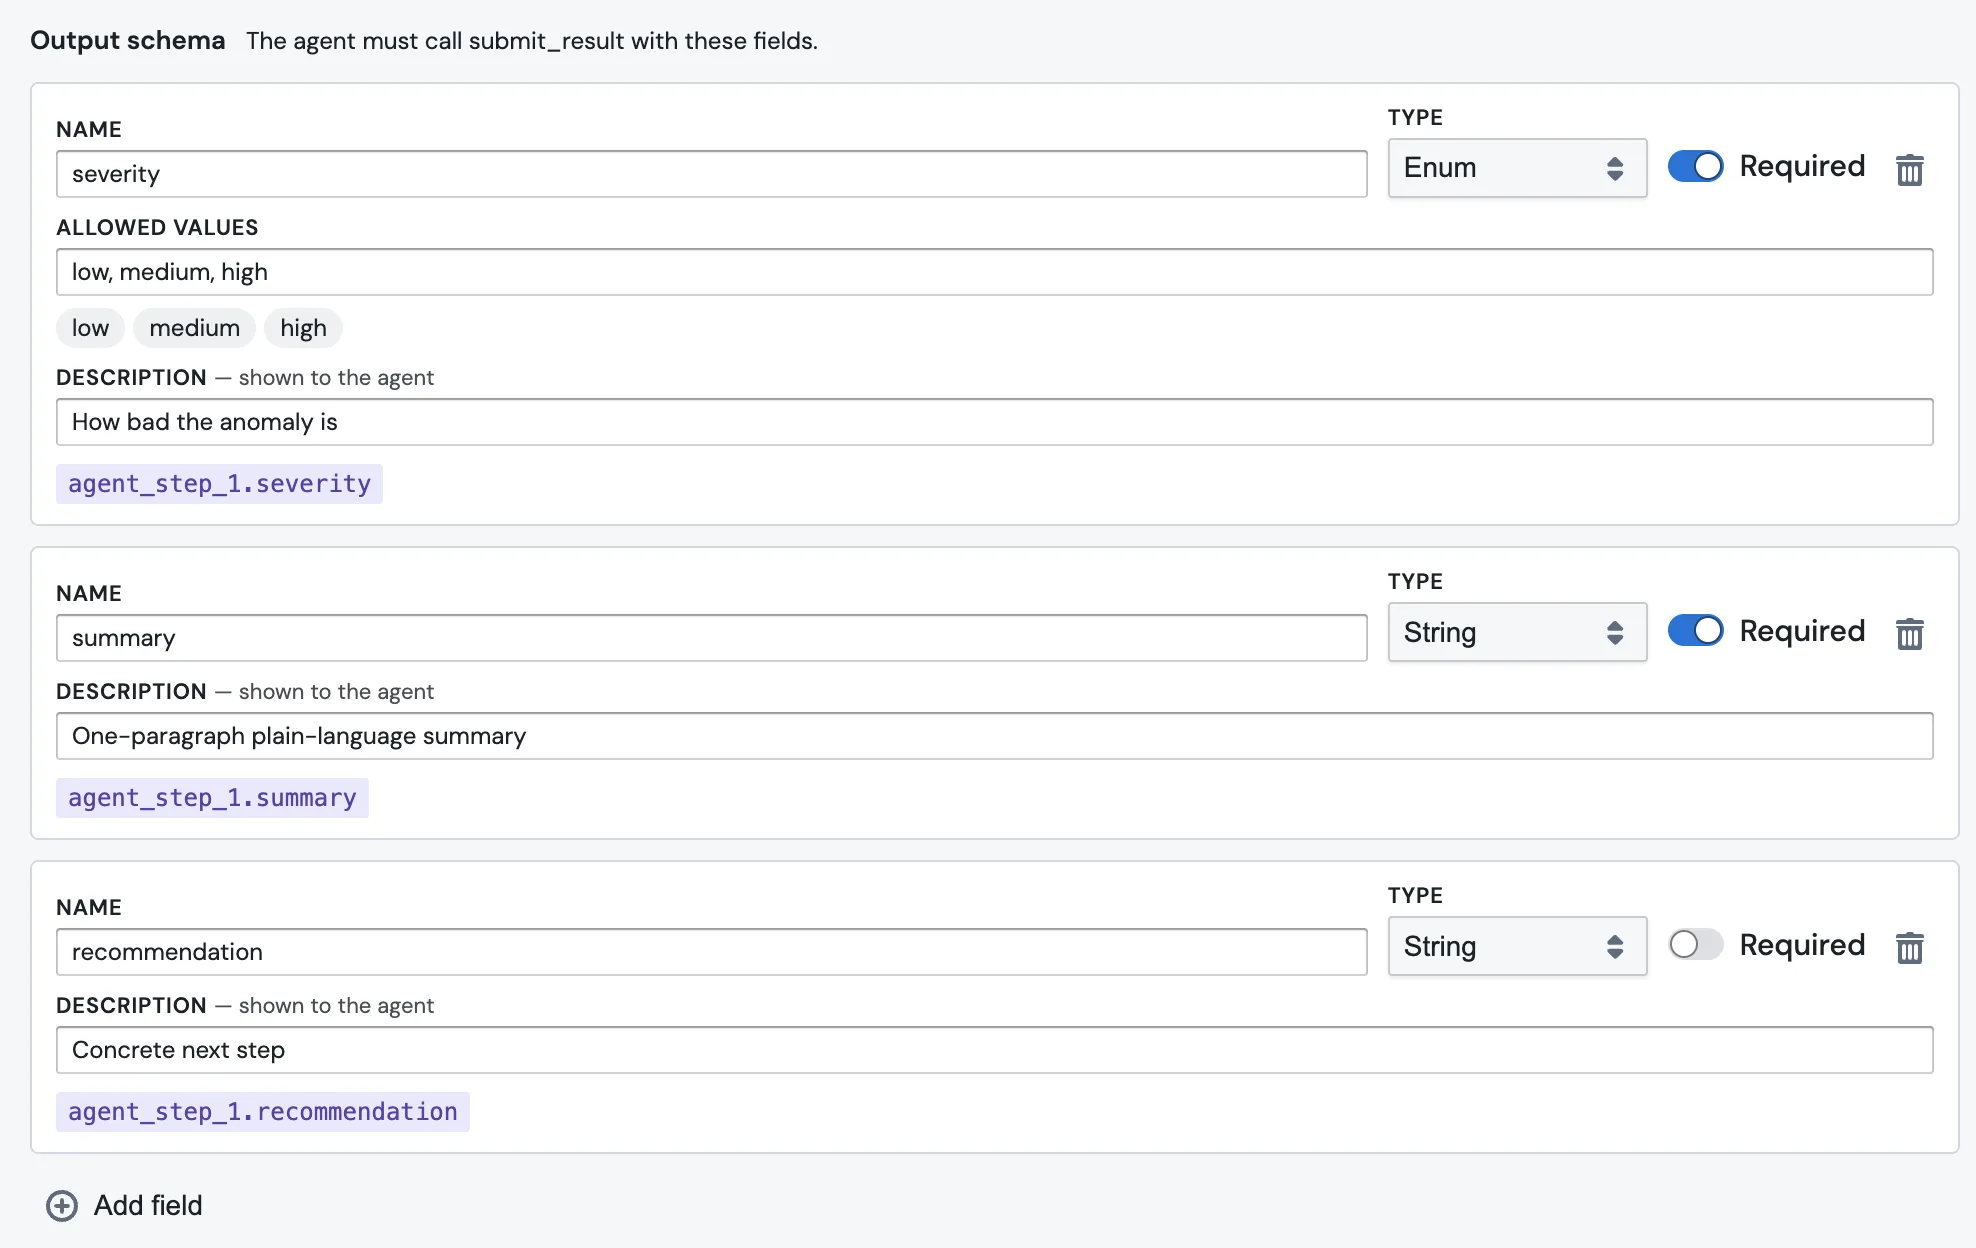
Each field has a few inputs:
- Name is what you'll reference downstream, like
severity. - Type is one of
String,Number,Boolean,Enum, orList of strings. ForEnum, an Allowed values field appears for the comma-separated options, which then render as chips below. - Required can be toggled off if the field is optional.
- Description is shown to the agent. This is the single most important box on the page. The agent reads it. "How bad the anomaly is" tells the agent what
severitymeans; leaving it blank means the agent has to guess.
Mechanically the agent fulfils the schema by calling a tool literally named submit_result. You'll see the call in the chat session. You don't have to know that to use the feature, but it helps when you're debugging.
Each field gets its own merge chip below the row, like agent_step_1.severity, ready to paste into the destination block.
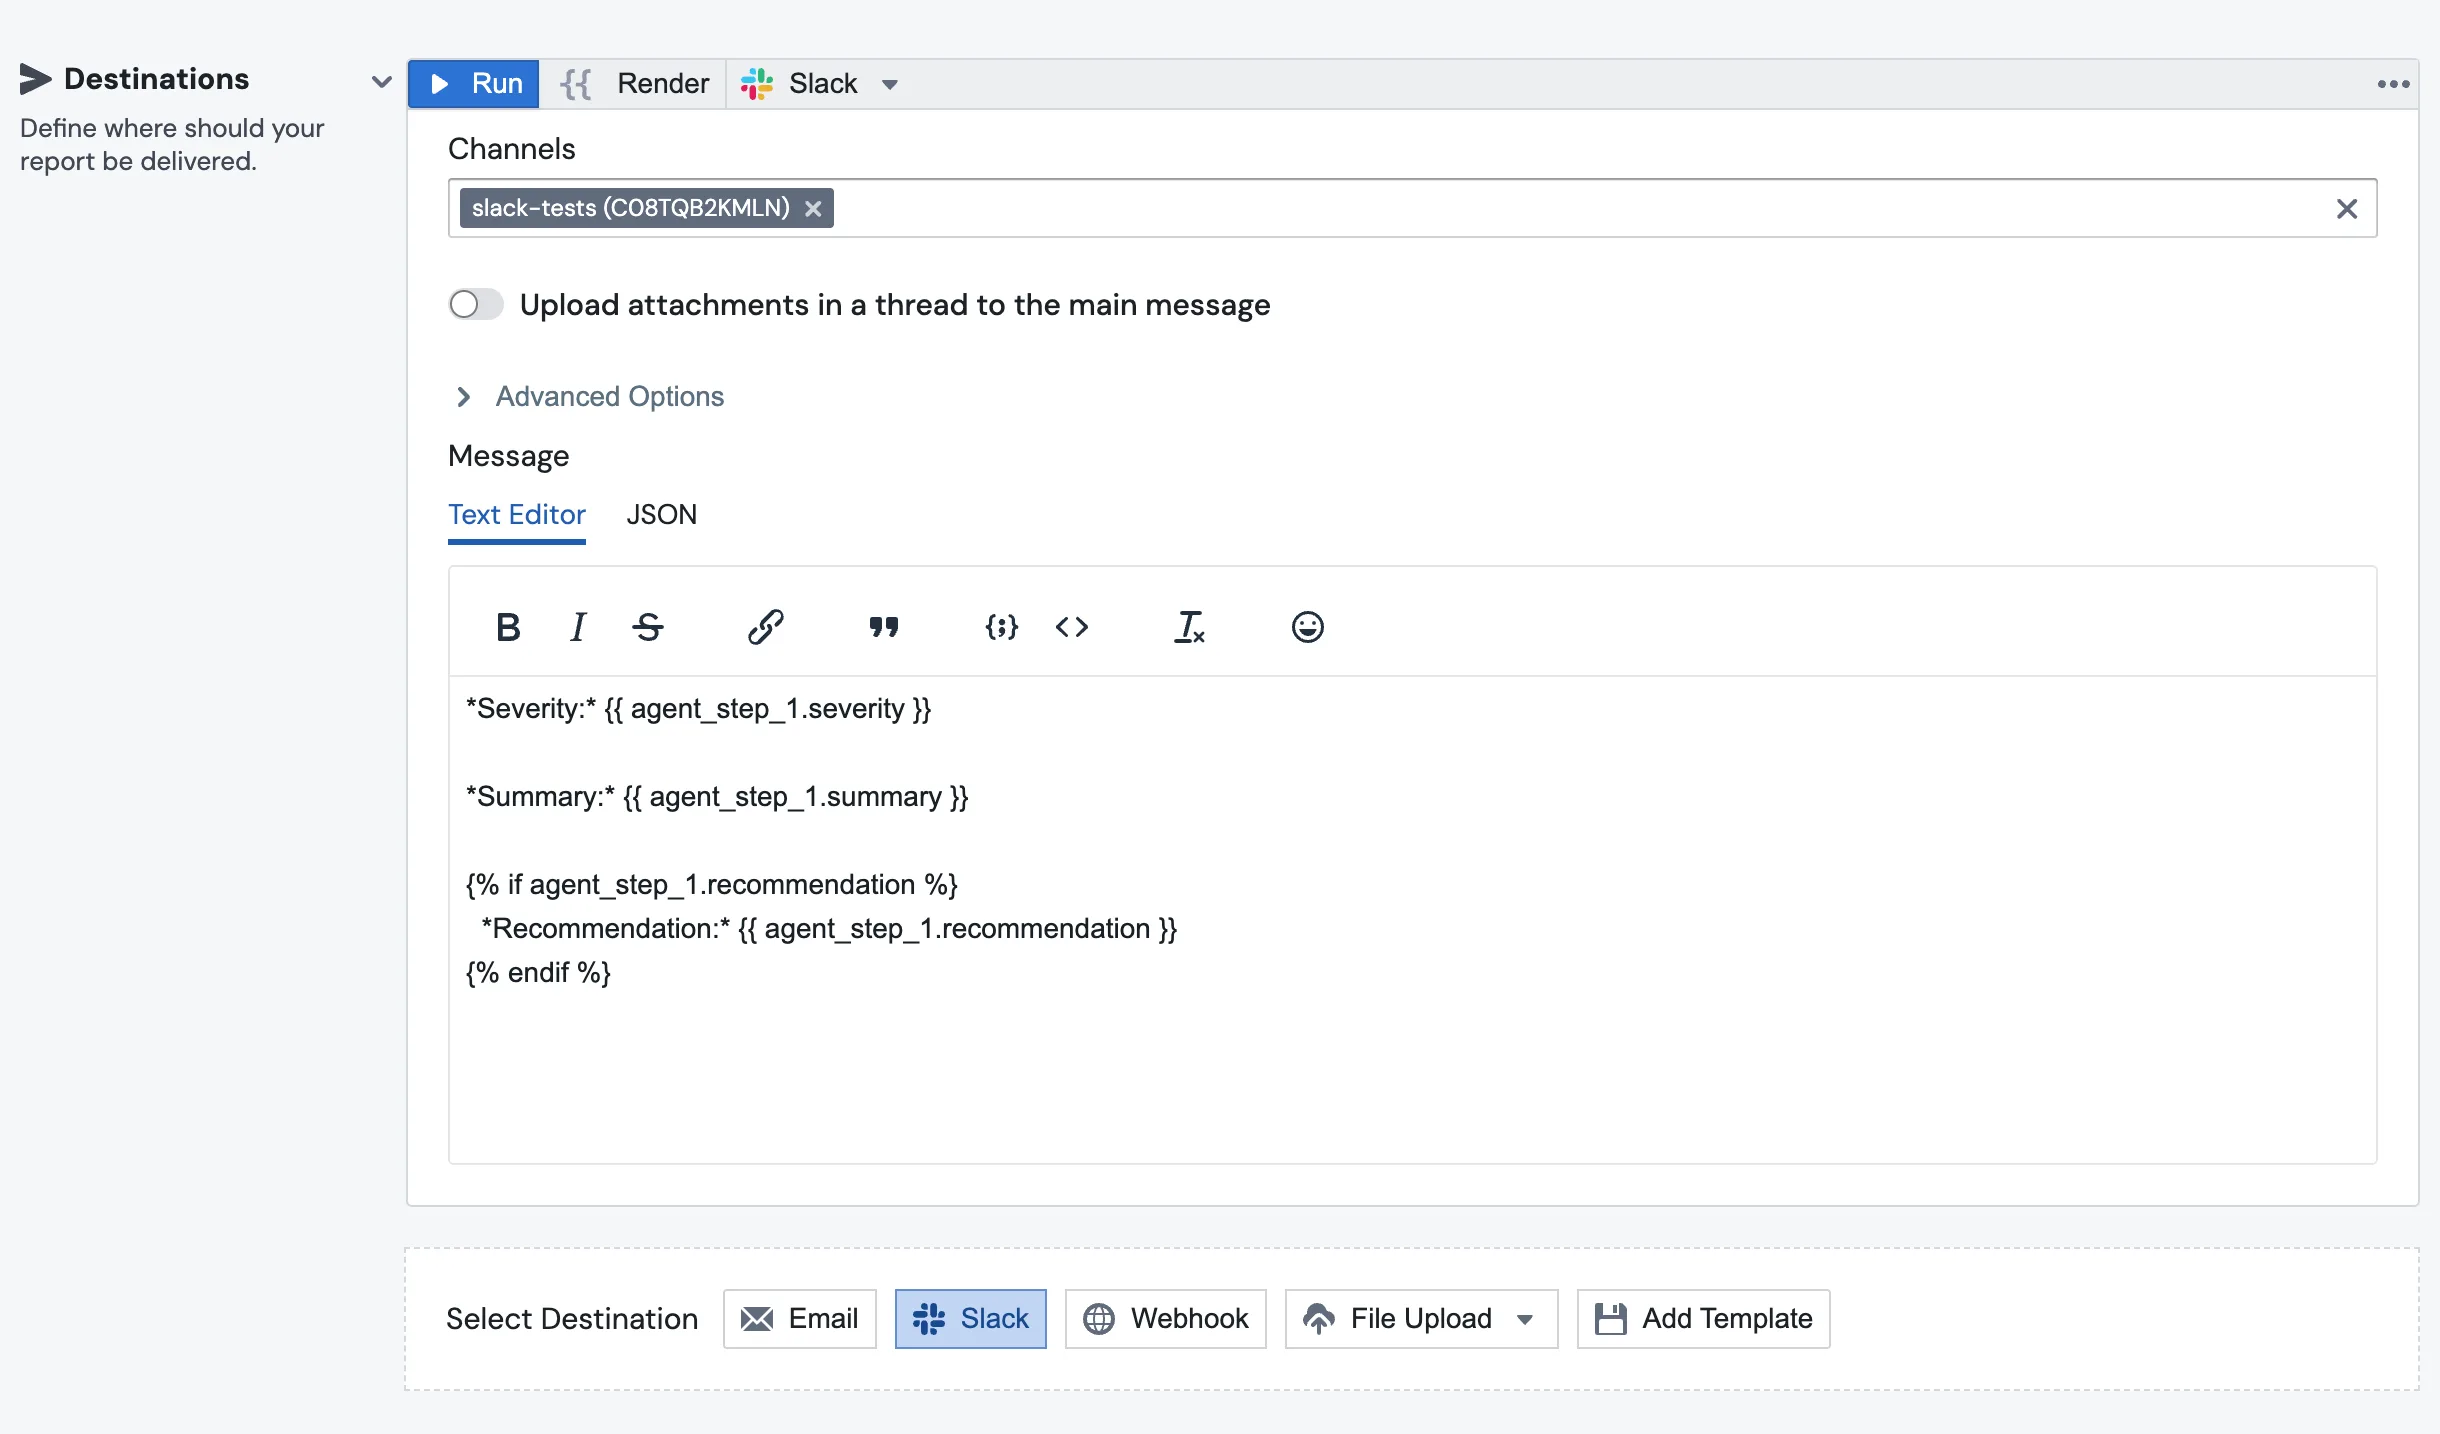
7. Wire the destination
Add a Slack (or Email, or anything else) destination at the bottom of the report. Reference the agent's output the same way you'd reference any other block:
*Severity:* {{ agent_step_1.severity }}
*Summary:* {{ agent_step_1.summary }}

{% if agent_step_1.recommendation %}
  *Recommendation:* {{ agent_step_1.recommendation }}
{% endif %}
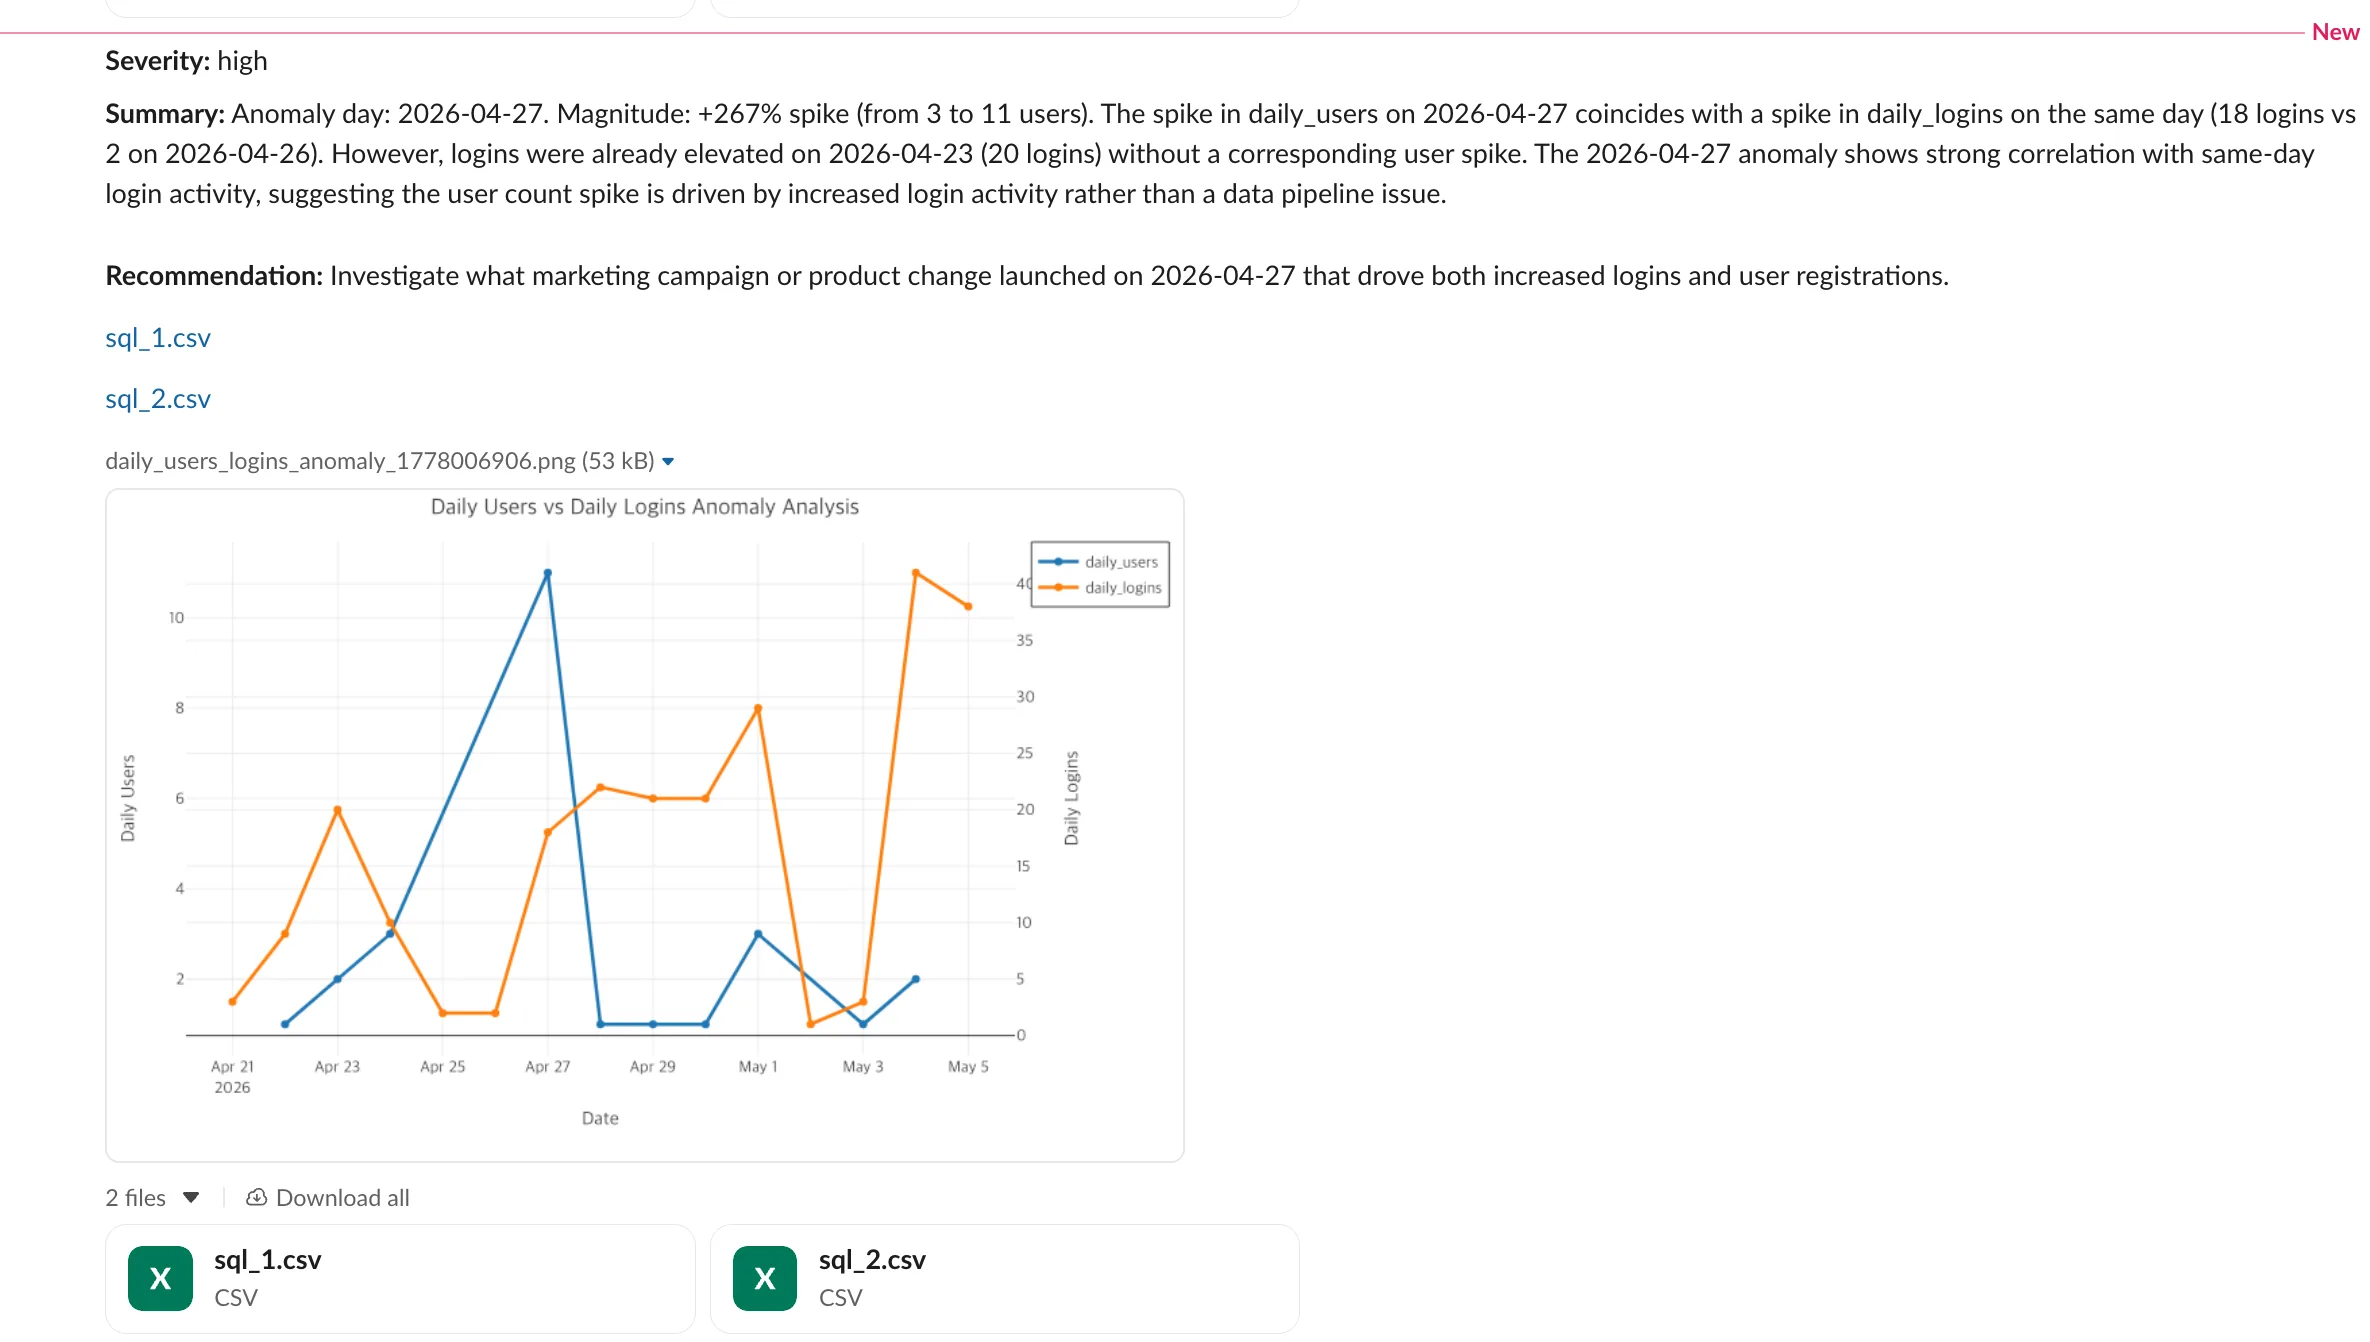
The Slack message that lands in the channel pulls the structured fields straight out of agent_step_1:
While you're at the bottom of the report, find the Additional Options panel. The Agent Step max cost per run (USD) field caps the total spend across every Agent Step in the report. It defaults to $5. So if you have three steps each capped at $1 but the report cap is $2, the third step won't even start.
8. Hit Run
You'll get a result panel with the agent's reply, the structured fields, and a footer that tells you exactly what was spent.
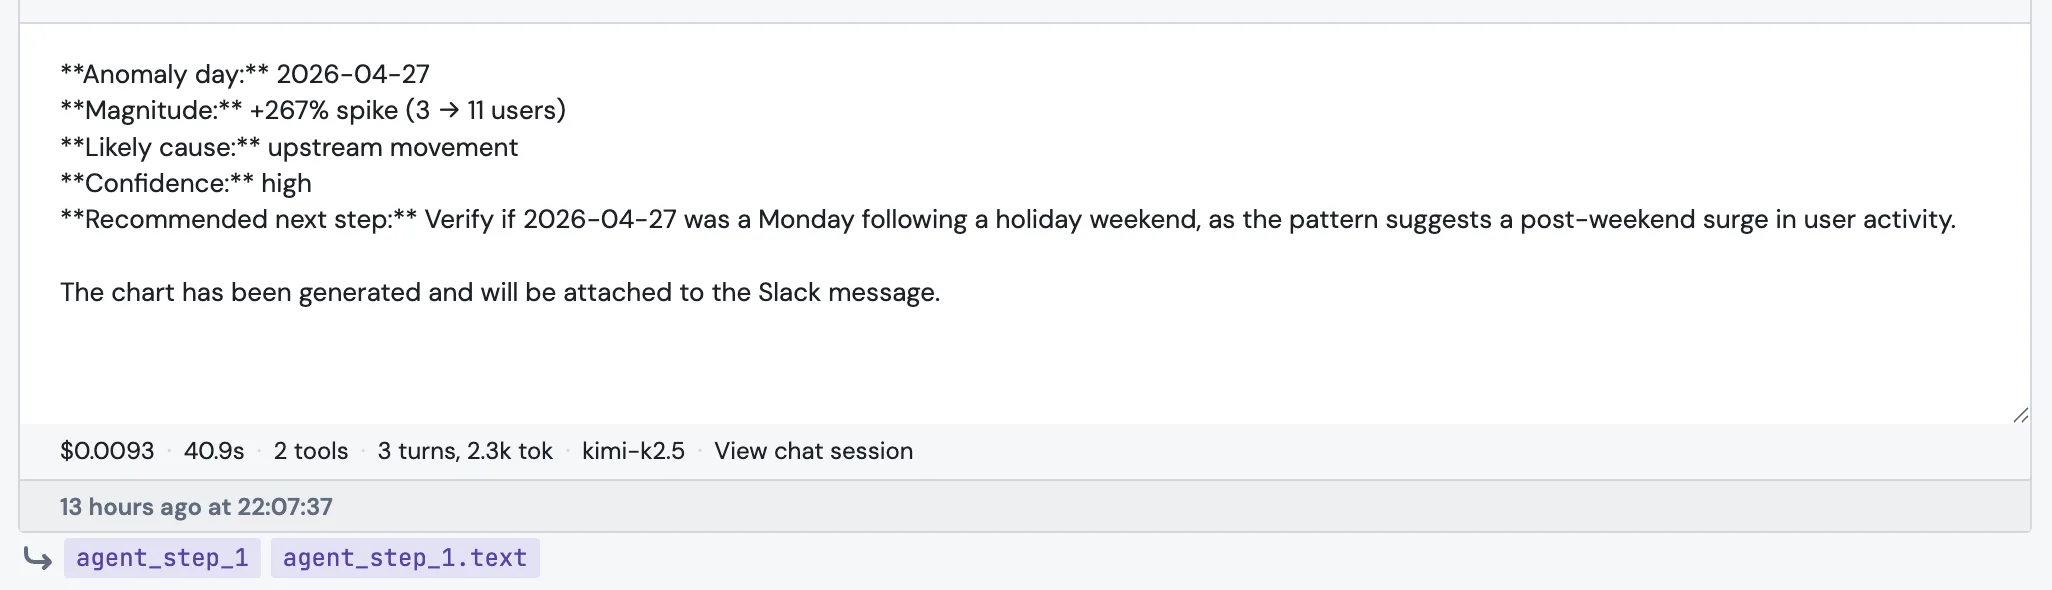
The footer reads, left to right: cost · duration · tool count · turns and tokens · model · View chat session. The chat session link is the place to go when something looks wrong. It shows every tool call, every SQL query, and every message the agent wrote during this step.
Referencing the result downstream
Anywhere below the step, the result is just another block. There are four ways to reach into it.
{{ agent_step_1.text }} gives you the agent's free-form reply. {{ agent_step_1.severity }} (or whatever field name you defined) gives you a single field from the output schema, accessed directly with no .fields in the middle. {{ agent_step_1.attachment_urls }} is a list of file URLs the agent produced, like chart exports. And bare {{ agent_step_1 }} is shorthand for .text, useful inside an email or Slack body.
A typical anomaly report ends up looking like this: a SQL block to pull the suspicious metric, an Agent Step to investigate (with severity, summary, and recommendation in the output schema), and a Slack block to render the three fields into a message.
Budgets, in one place
There are three layers of budget, and it's worth knowing all of them because they fail in different ways.
| Layer | Where it lives | Default | What happens when hit |
|---|---|---|---|
Per-step Max cost (USD) |
Settings on the step itself | $1 | Step fails. Always loud, even with Use fallback text. |
Per-report Agent Step max cost per run |
Additional Options at the bottom of the report | $5 | Step doesn't start. |
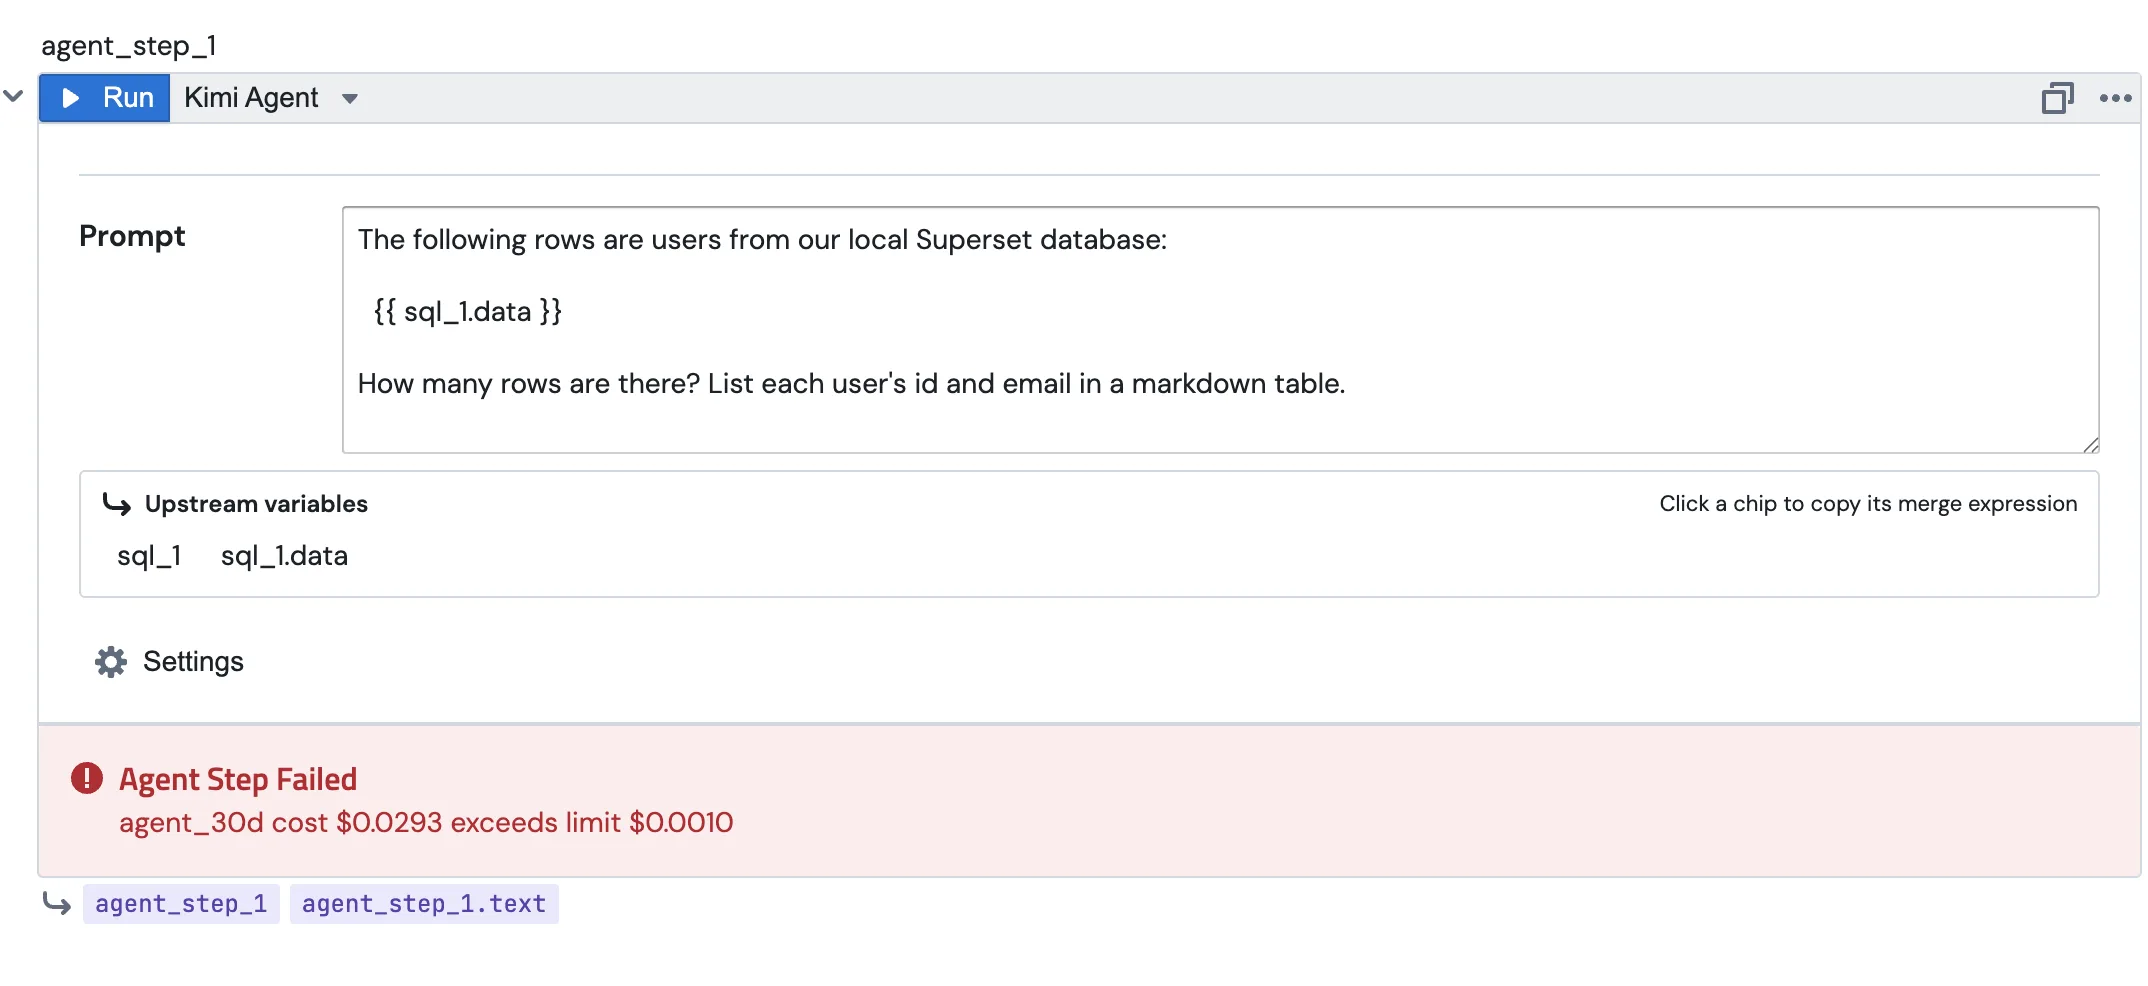
| Per-agent 30-day cost | Agent configuration page | Whatever you set | Step fails with agent_30d cost $X exceeds limit $Y. |
The third one trips people up the most. Even if your step's Max cost is fine and the report cap is fine, the agent itself has its own monthly ceiling, and a busy agent can hit it.
Two more brakes worth knowing about. A single report can contain at most three Agent Steps. That's enough for the common shape (investigate, categorise, respond), but small enough that you can't accidentally chain ten LLM calls into one report. And Agent Steps aren't allowed inside for_loop (Dynamic Report Personalization) in v1, because a daily schedule fanned out across a 1,000-row list with a $1-per-step cap means up to $1,000 every day. We'll lift the loop restriction once there's per-loop cost control. For now, the workaround is to do the LLM work once outside the loop.
What the agent can and can't do during a step
A step is the same agent you'd chat with. Same tools, same permissions, same skills, with one difference: mutating tools are stripped. The step can read SQL, query metrics views, and produce charts. It can't send emails, post to Slack, or save new content on its own. That part is the destination block's job.
The split is deliberate. The agent thinks; the report delivers. Putting the destination in the agent's hands during a fanned-out scheduled run is how you end up flooding a Slack channel from one bug.
Triggering the whole thing from outside
A common pattern is to skip the schedule entirely and have an external system kick the report off when something happens. An alerting tool spots a metric anomaly, POSTs a JSON payload to a PushMetrics webhook, the report runs, and the Agent Step picks up the metric, dataset, and window from the payload and starts investigating.
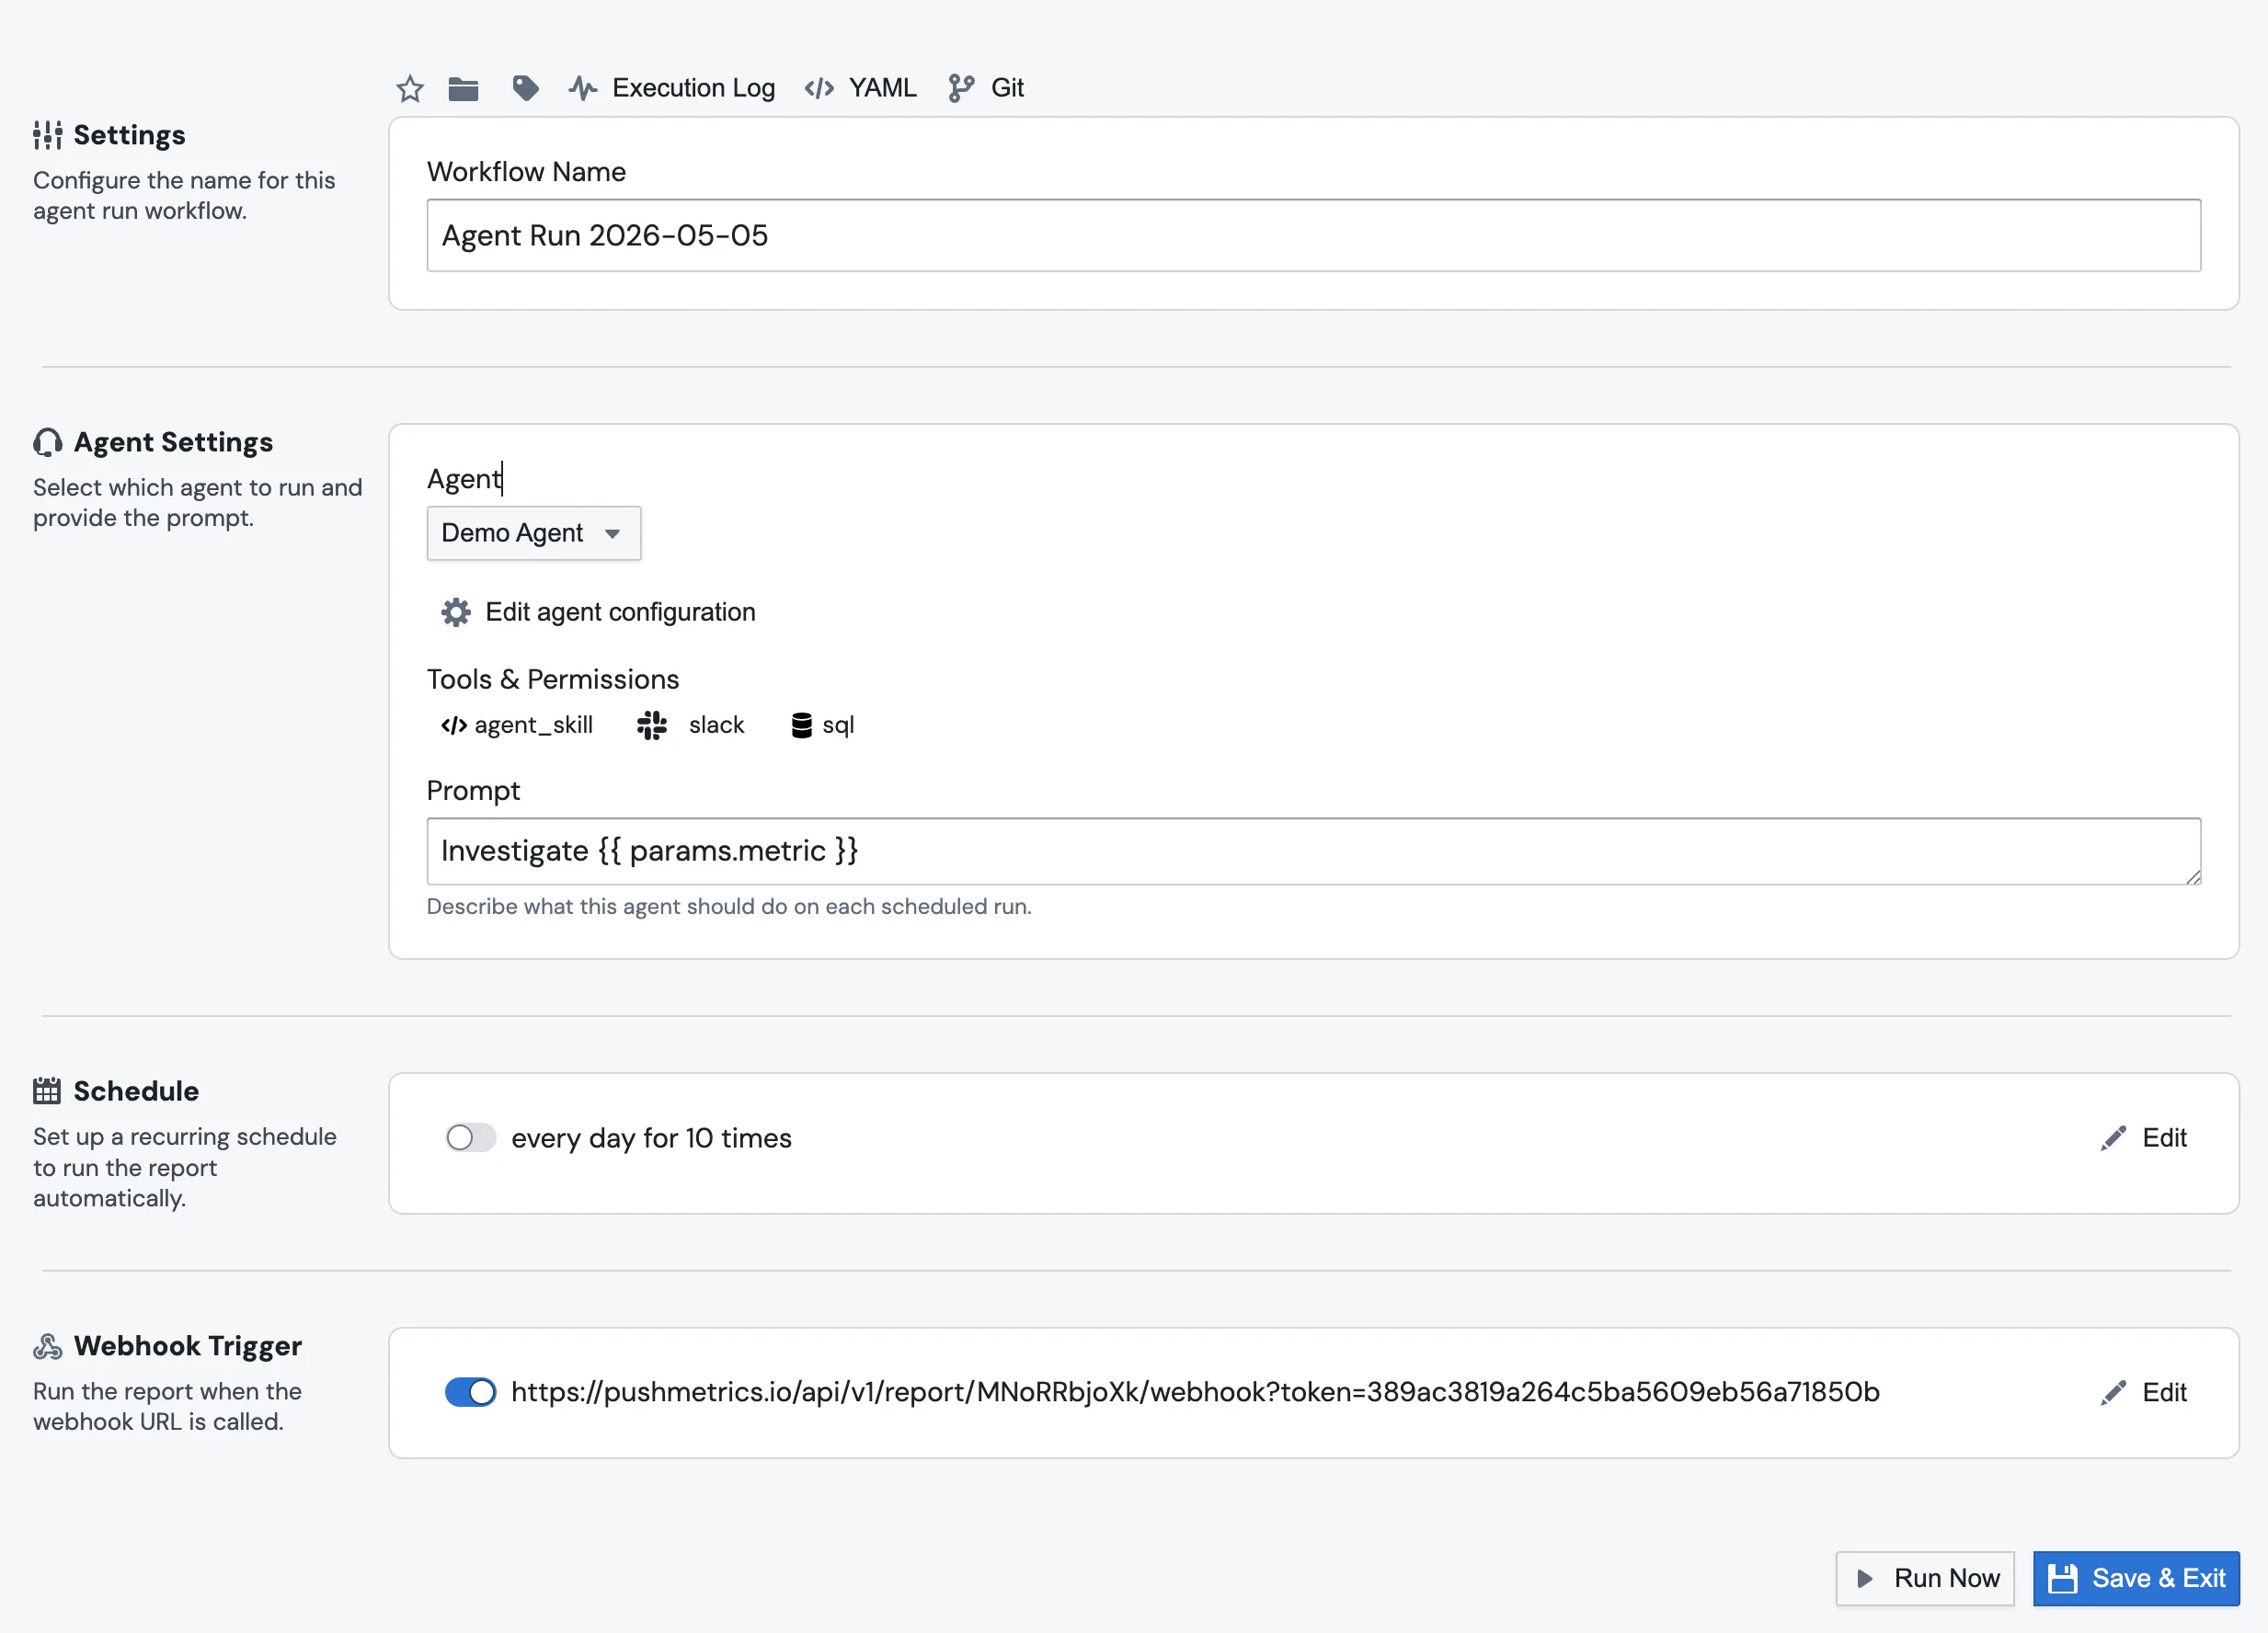
The webhook URL belongs to the report. Open the report editor, find the Webhook Trigger section, toggle it on, and copy the URL. The plumbing for getting the payload into the prompt is one extra step compared to chatting with an agent directly: the report's webhook overrides Parameter blocks by name rather than exposing a params.* namespace. So you set up the report like this:
- Add a Parameter block for each value you want from the payload, naming it to match the JSON key. For an alerting payload like
{"metric_name": "daily_users", "window_start": "...", "severity": "high"}, that's three Parameter blocks namedmetric_name,window_start, andseverity. - POST the payload at the webhook URL. Each matching Parameter block has its value replaced by the value from the payload for this run.
- In the Agent Step prompt below those Parameters, reference them as top-level Jinja variables:
A metric anomaly was just reported by our monitoring system:

- Metric: {{ metric_name }}
- Window: {{ window_start }} to {{ window_end }}
- Severity: {{ severity }}

The SQL above pulls the underlying timeseries.
Investigate what changed, and write up the most likely cause.
Trigger it with curl:
curl -X POST \
  "https://app.pushmetrics.io/api/v1/report/<report_id>/webhook?token=<token>" \
  -H "Content-Type: application/json" \
  -d '{
    "metric_name": "daily_users",
    "window_start": "2026-04-26T00:00Z",
    "window_end": "2026-04-27T00:00Z",
    "severity": "high"
  }'
You get the same control flow as a scheduled report (SQL, then Agent Step, then destination), except the trigger is an HTTP call from your own system and the agent has the alert's context to work with from the first turn.
If you want a simpler shape that skips the report entirely (no Parameter blocks, no SQL, no destination, just an agent with a prompt that consumes the payload directly), use an Agent Run with its own webhook trigger. The JSON payload is exposed inline three different ways: as {{ params.<key> }}, as {{ webhook.parameters.<key> }}, or as a top-level {{ <key> }}. Use whichever reads best.
Same payload, same shape of curl:
curl -X POST \
  "https://app.pushmetrics.io/api/v1/report/<agent_run_id>/webhook?token=<token>" \
  -H "Content-Type: application/json" \
  -d '{
    "metric_name": "daily_users",
    "window_start": "2026-04-26T00:00Z",
    "window_end": "2026-04-27T00:00Z",
    "severity": "high"
  }'
Full setup for the Agent Run flavor is on the Triggering Agents via Webhook page.
When something looks wrong, open the chat session
Every Agent Step run produces a chat session, the same kind of session you'd see if you talked to the agent directly. Click View chat session in the result panel, or the same link from the row in the execution log, and you'll see the exact prompt the agent received with every upstream merge field already substituted, every tool call it made (the SQL it ran, the queries it sent, the charts it built), the final submit_result call where it filled in your output schema if you defined one, and the same cost, tokens, model, and duration numbers shown in the result panel footer.
The execution log lists every Agent Step run alongside the rest of the report's blocks, so you can spot a slow or failing step at a glance:
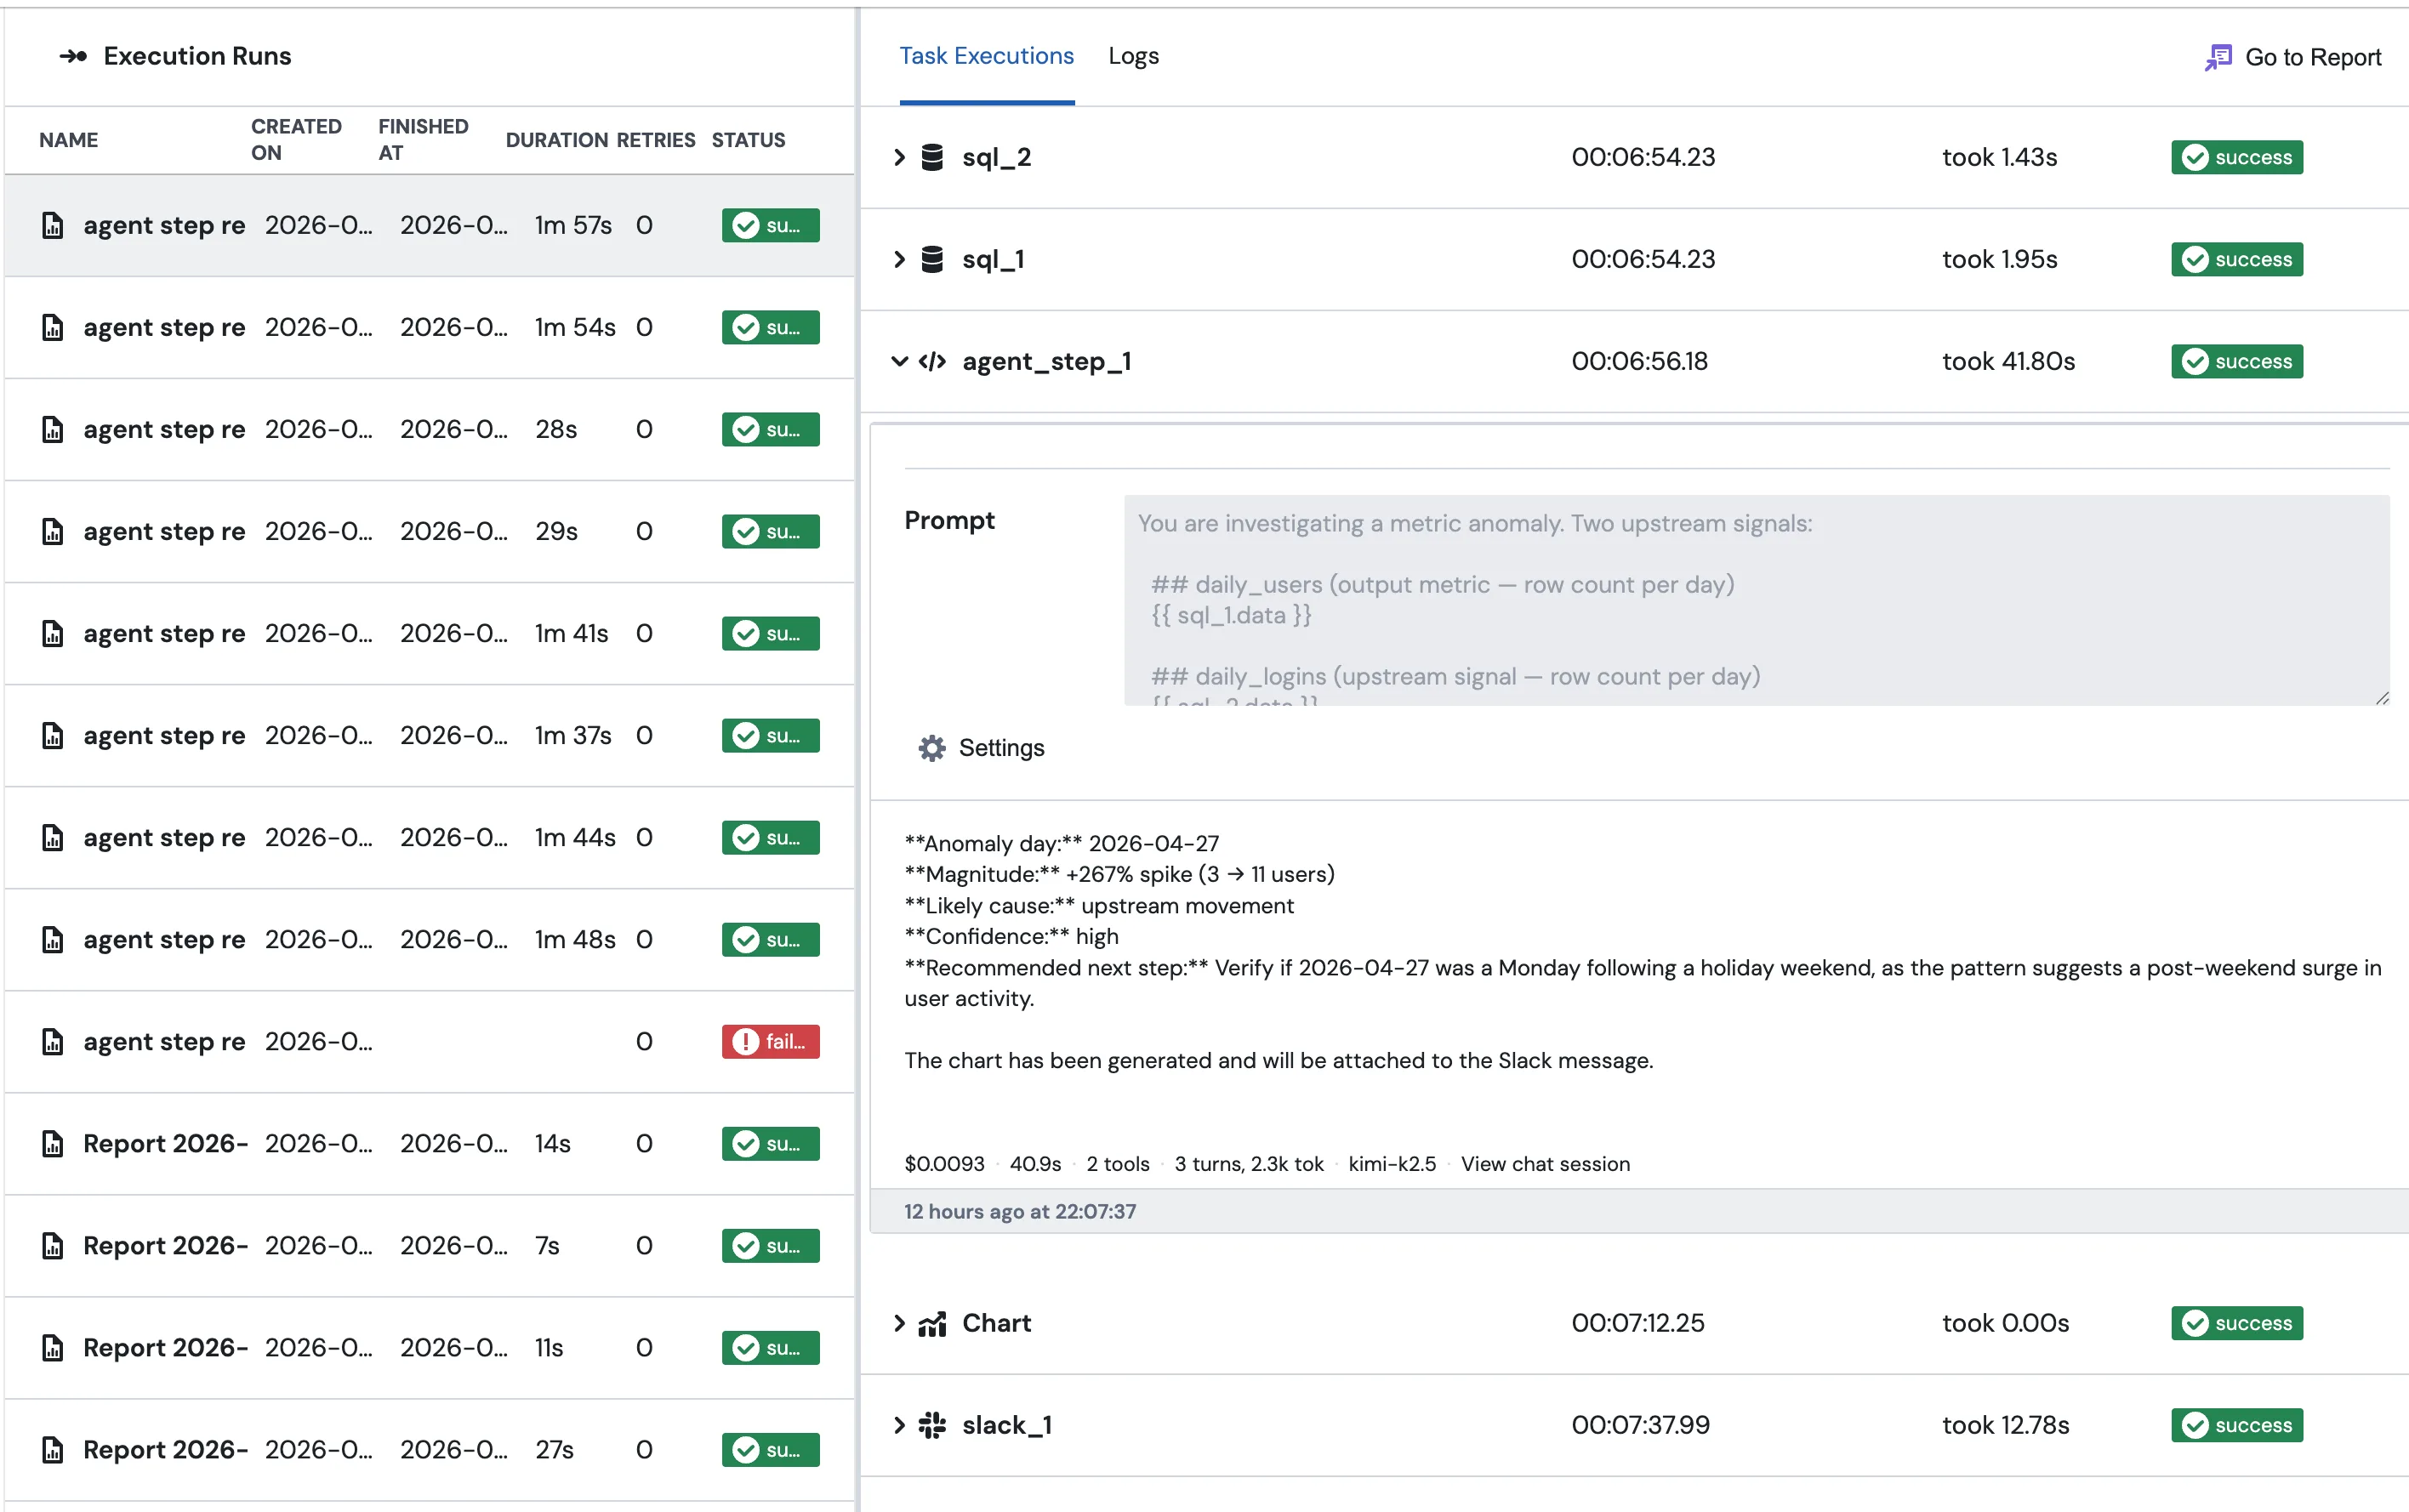
If a step writes something weird, the answer is almost always in there.
A few tips
Keep prompts short and specific. "Summarise the table above in two sentences for a Slack channel of analysts" gets you a much more useful answer than "give me a summary".
Use Output schema the moment a downstream block needs to branch on the agent's output. It's the only way to keep the report's behaviour deterministic.
Write good field descriptions. They're the prompt the agent sees for each field. "How bad the anomaly is" is the difference between getting severity: medium back and getting severity: "kind of bad I guess".
Set Max cost low to start. $0.20 is enough for most summarisation work. Raise it once you actually know the step needs more.
When a step misbehaves, open the chat session before anything else. The reply on its own rarely tells you why the agent went somewhere unexpected. The tool trace usually does.