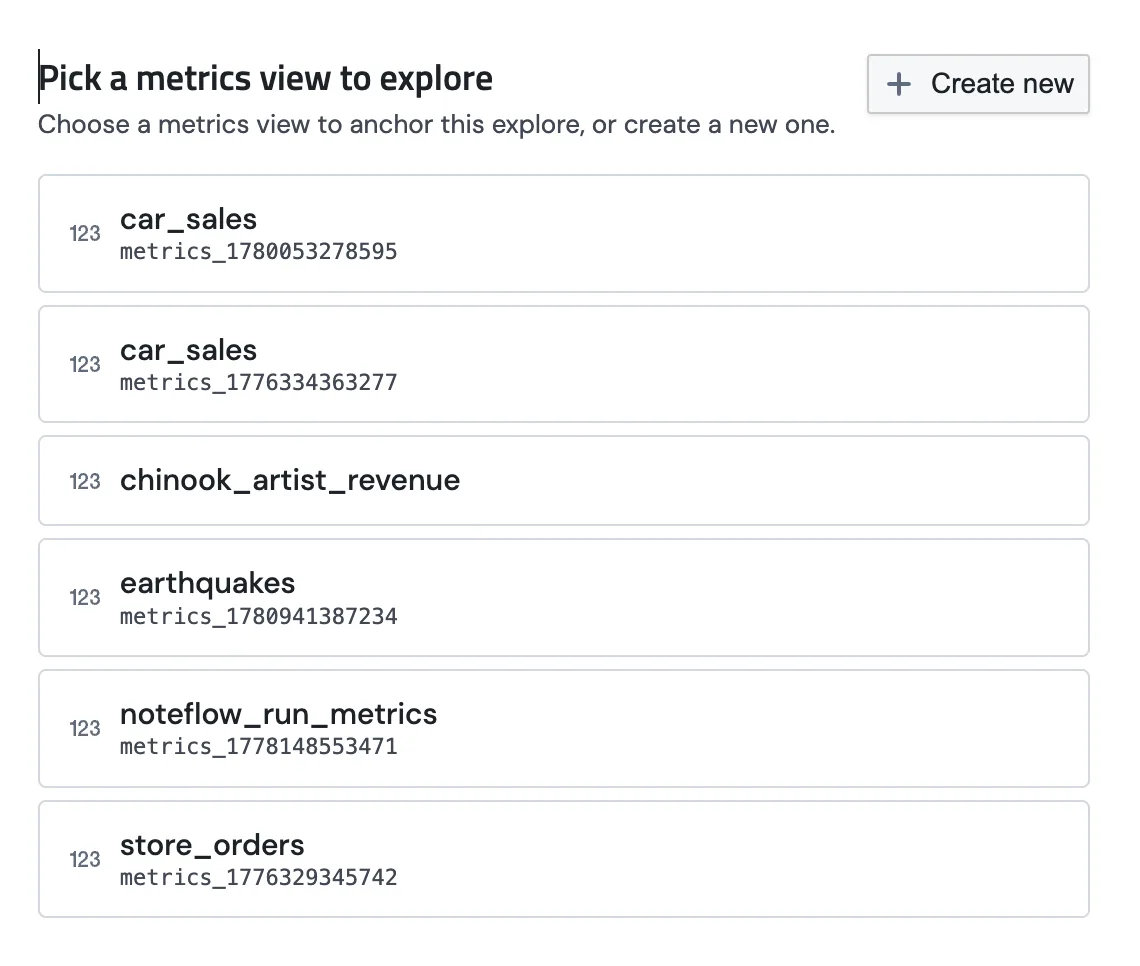
An Explore is a saved chart built on a Metric Block. You pick the measures and dimensions you want, add filters or a time range, choose a chart type, and PushMetrics compiles your selections into a single SQL query, runs it, and renders the result. No SQL required, though you can always see exactly what ran.
Because an Explore is anchored on a Metric Block, the numbers stay consistent: the same measure means the same thing in every chart.
Creating an Explore
The query builder
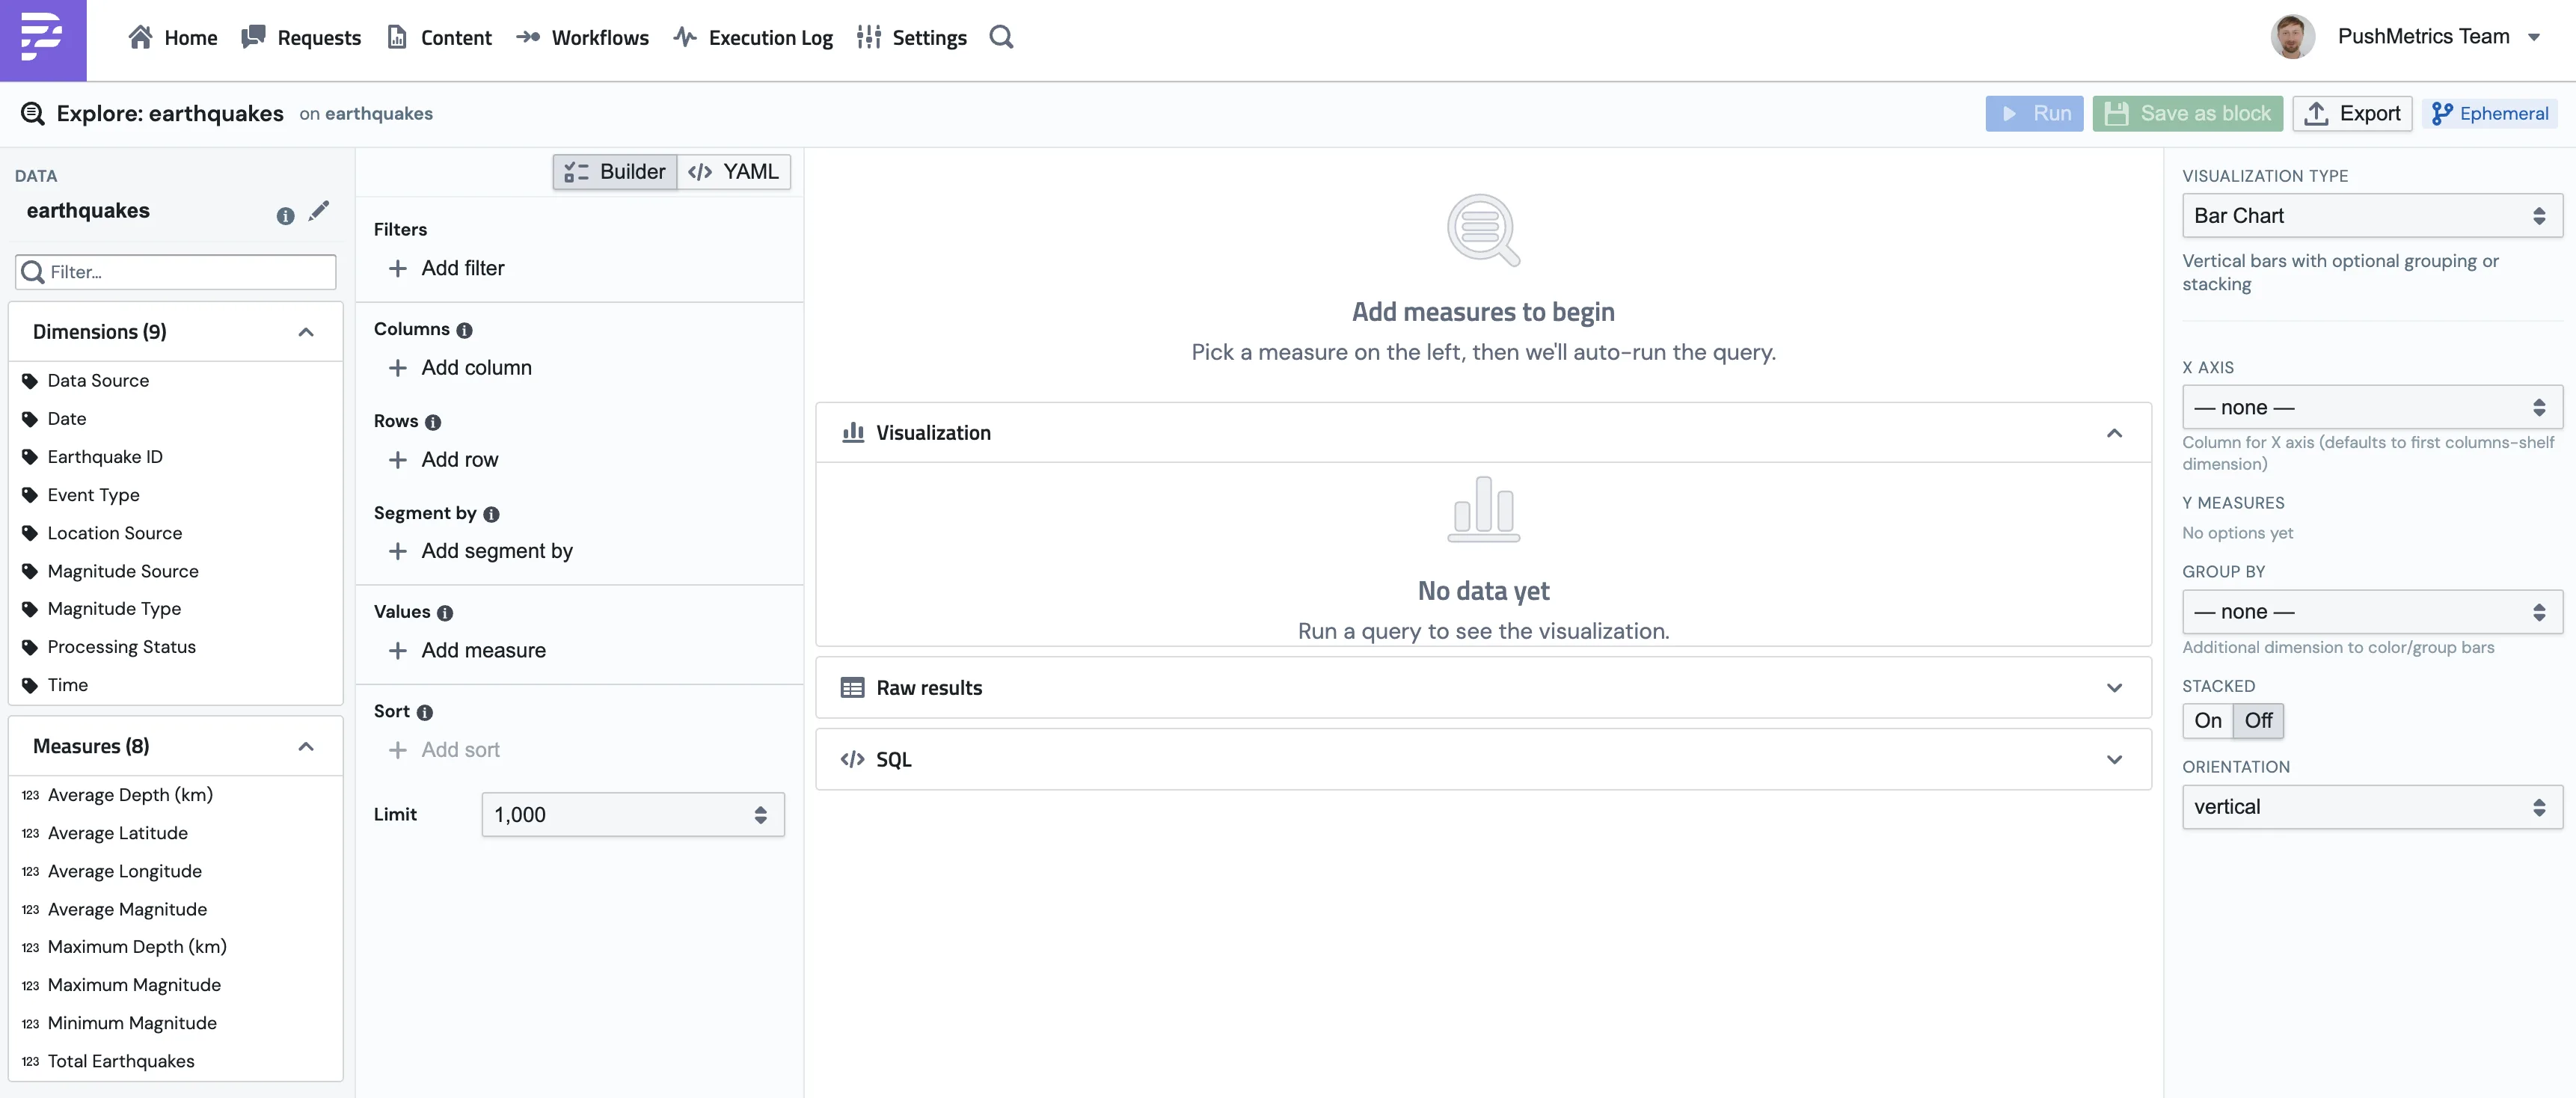
The Explore screen has three areas:
- Data panel (left) holds the measures and dimensions available on the Metric Block, plus the shelves where you build the query.
- Result (middle) shows the chart, with tabs for Raw results (a table) and SQL (the generated query).
- Visualization (right) is the chart type picker and per-chart settings.
Shelves
Drag or click fields onto these shelves to shape the query:
| Shelf | What it does |
|---|---|
| Rows | Dimensions to break the data down by (row groups) |
| Columns | Dimensions that pivot across columns |
| Segment by | A dimension that splits the result into small multiples or color groups |
| Measures (Add measure) | The numbers to plot, picked from the block's measures |
| Filters | Narrow the rows (see operators below) |
| Sort | Order the result by any dimension or measure, ascending or descending |
| Limit | Cap the number of rows returned (default 1000) |
Filters
Add a filter, pick a field, and choose an operator. Available operators:
= != > < >= <= IN NOT IN LIKE NOT LIKE IS NULL IS NOT NULL
For IN and NOT IN, enter a comma-separated list (a, b, c). IS NULL and IS NOT NULL take no value.
Time ranges and grains
If the Metric Block has a timeseries column, you get time controls for free:
- Time range is a relative range like Today, Yesterday, Last 7 days, Last 30 days, Last 90 days, This week, This month, This year, or Last 1 year. You can also pick an absolute date range yourself.
- Time grain buckets a date dimension by Year, Quarter, Month, Week, Day, Hour, or raw (no bucketing).
- Time function controls how the grouping works. Truncate uses
DATE_TRUNC, which keeps the date type and pins to the start of the period (best for time series). Extract usesEXTRACT, which returns the number, for example4for April (best for seasonality).
Running the query
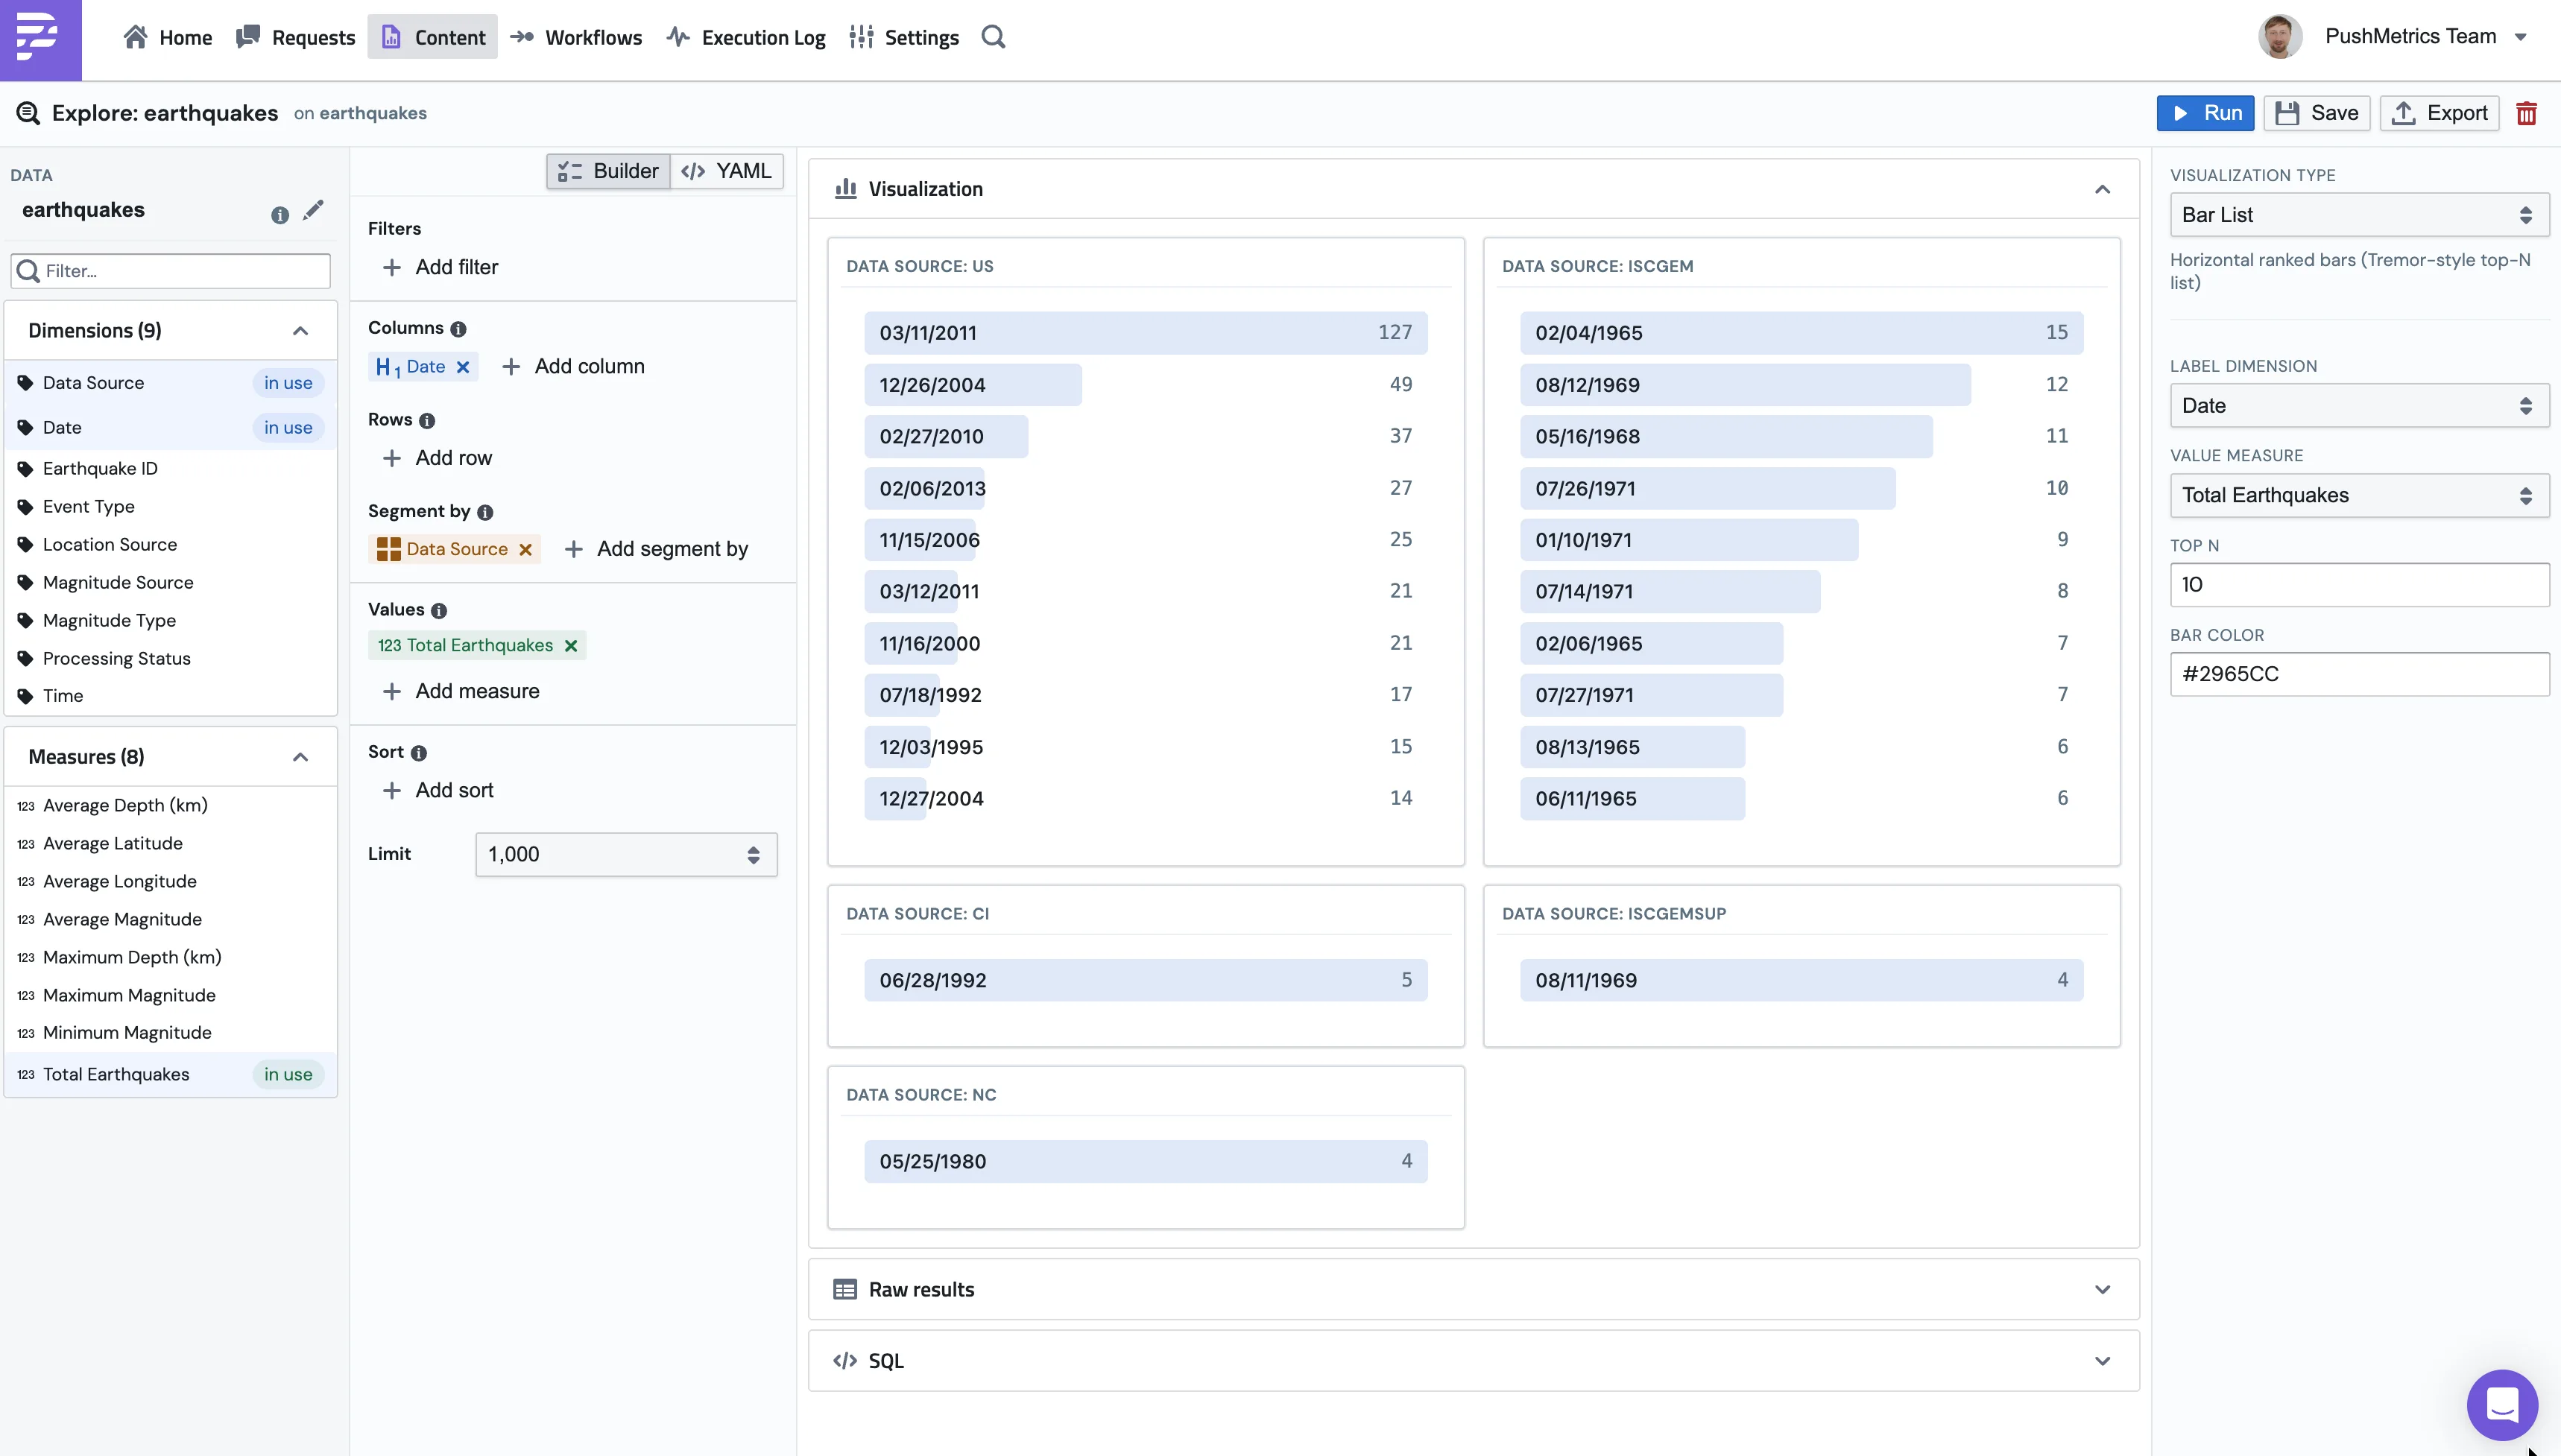
Visualization types
Pick the chart that fits your data. Each type has its own settings (which field is the X axis, what to group by, stacking, etc.) in the panel on the right.
Builder vs YAML
Like Metric Blocks, an Explore has a Builder view (the visual shelves) and a YAML view (the same query and visualization as text). Toggle between them at the top. The YAML is useful for copying a chart definition, reviewing it, or version-controlling it.
Exporting
From a saved Explore you can Export the result directly. The formats are:
- PNG for a chart image (set width, height, and background)
- PDF for a document (with page size, orientation, and margin)
- CSV for the raw data
- XLSX for an Excel workbook
To deliver a chart on a schedule instead of a one-off export, attach the Explore to a report. See Charts in Reports & Slack.
Next steps
- Content & Metric Blocks covers the data source behind every Explore.
- Charts in Reports & Slack shows how to schedule a chart out to your team.
- Agents, Metrics & Explore shows how to skip the builder: ask an AI agent to build the chart in chat, where it renders inline and can be emailed or Slacked on request.