Content is where your reusable analytics live. It's a single page that lists two kinds of object. Metric Blocks define how your data should be counted, and Explores are saved charts built on top of those definitions. Define a metric once, and every chart, report, and AI agent reads from the same place.
This whole section is enabled per workspace. If you don't see a Content tab in the top navigation, ask your admin to turn it on.
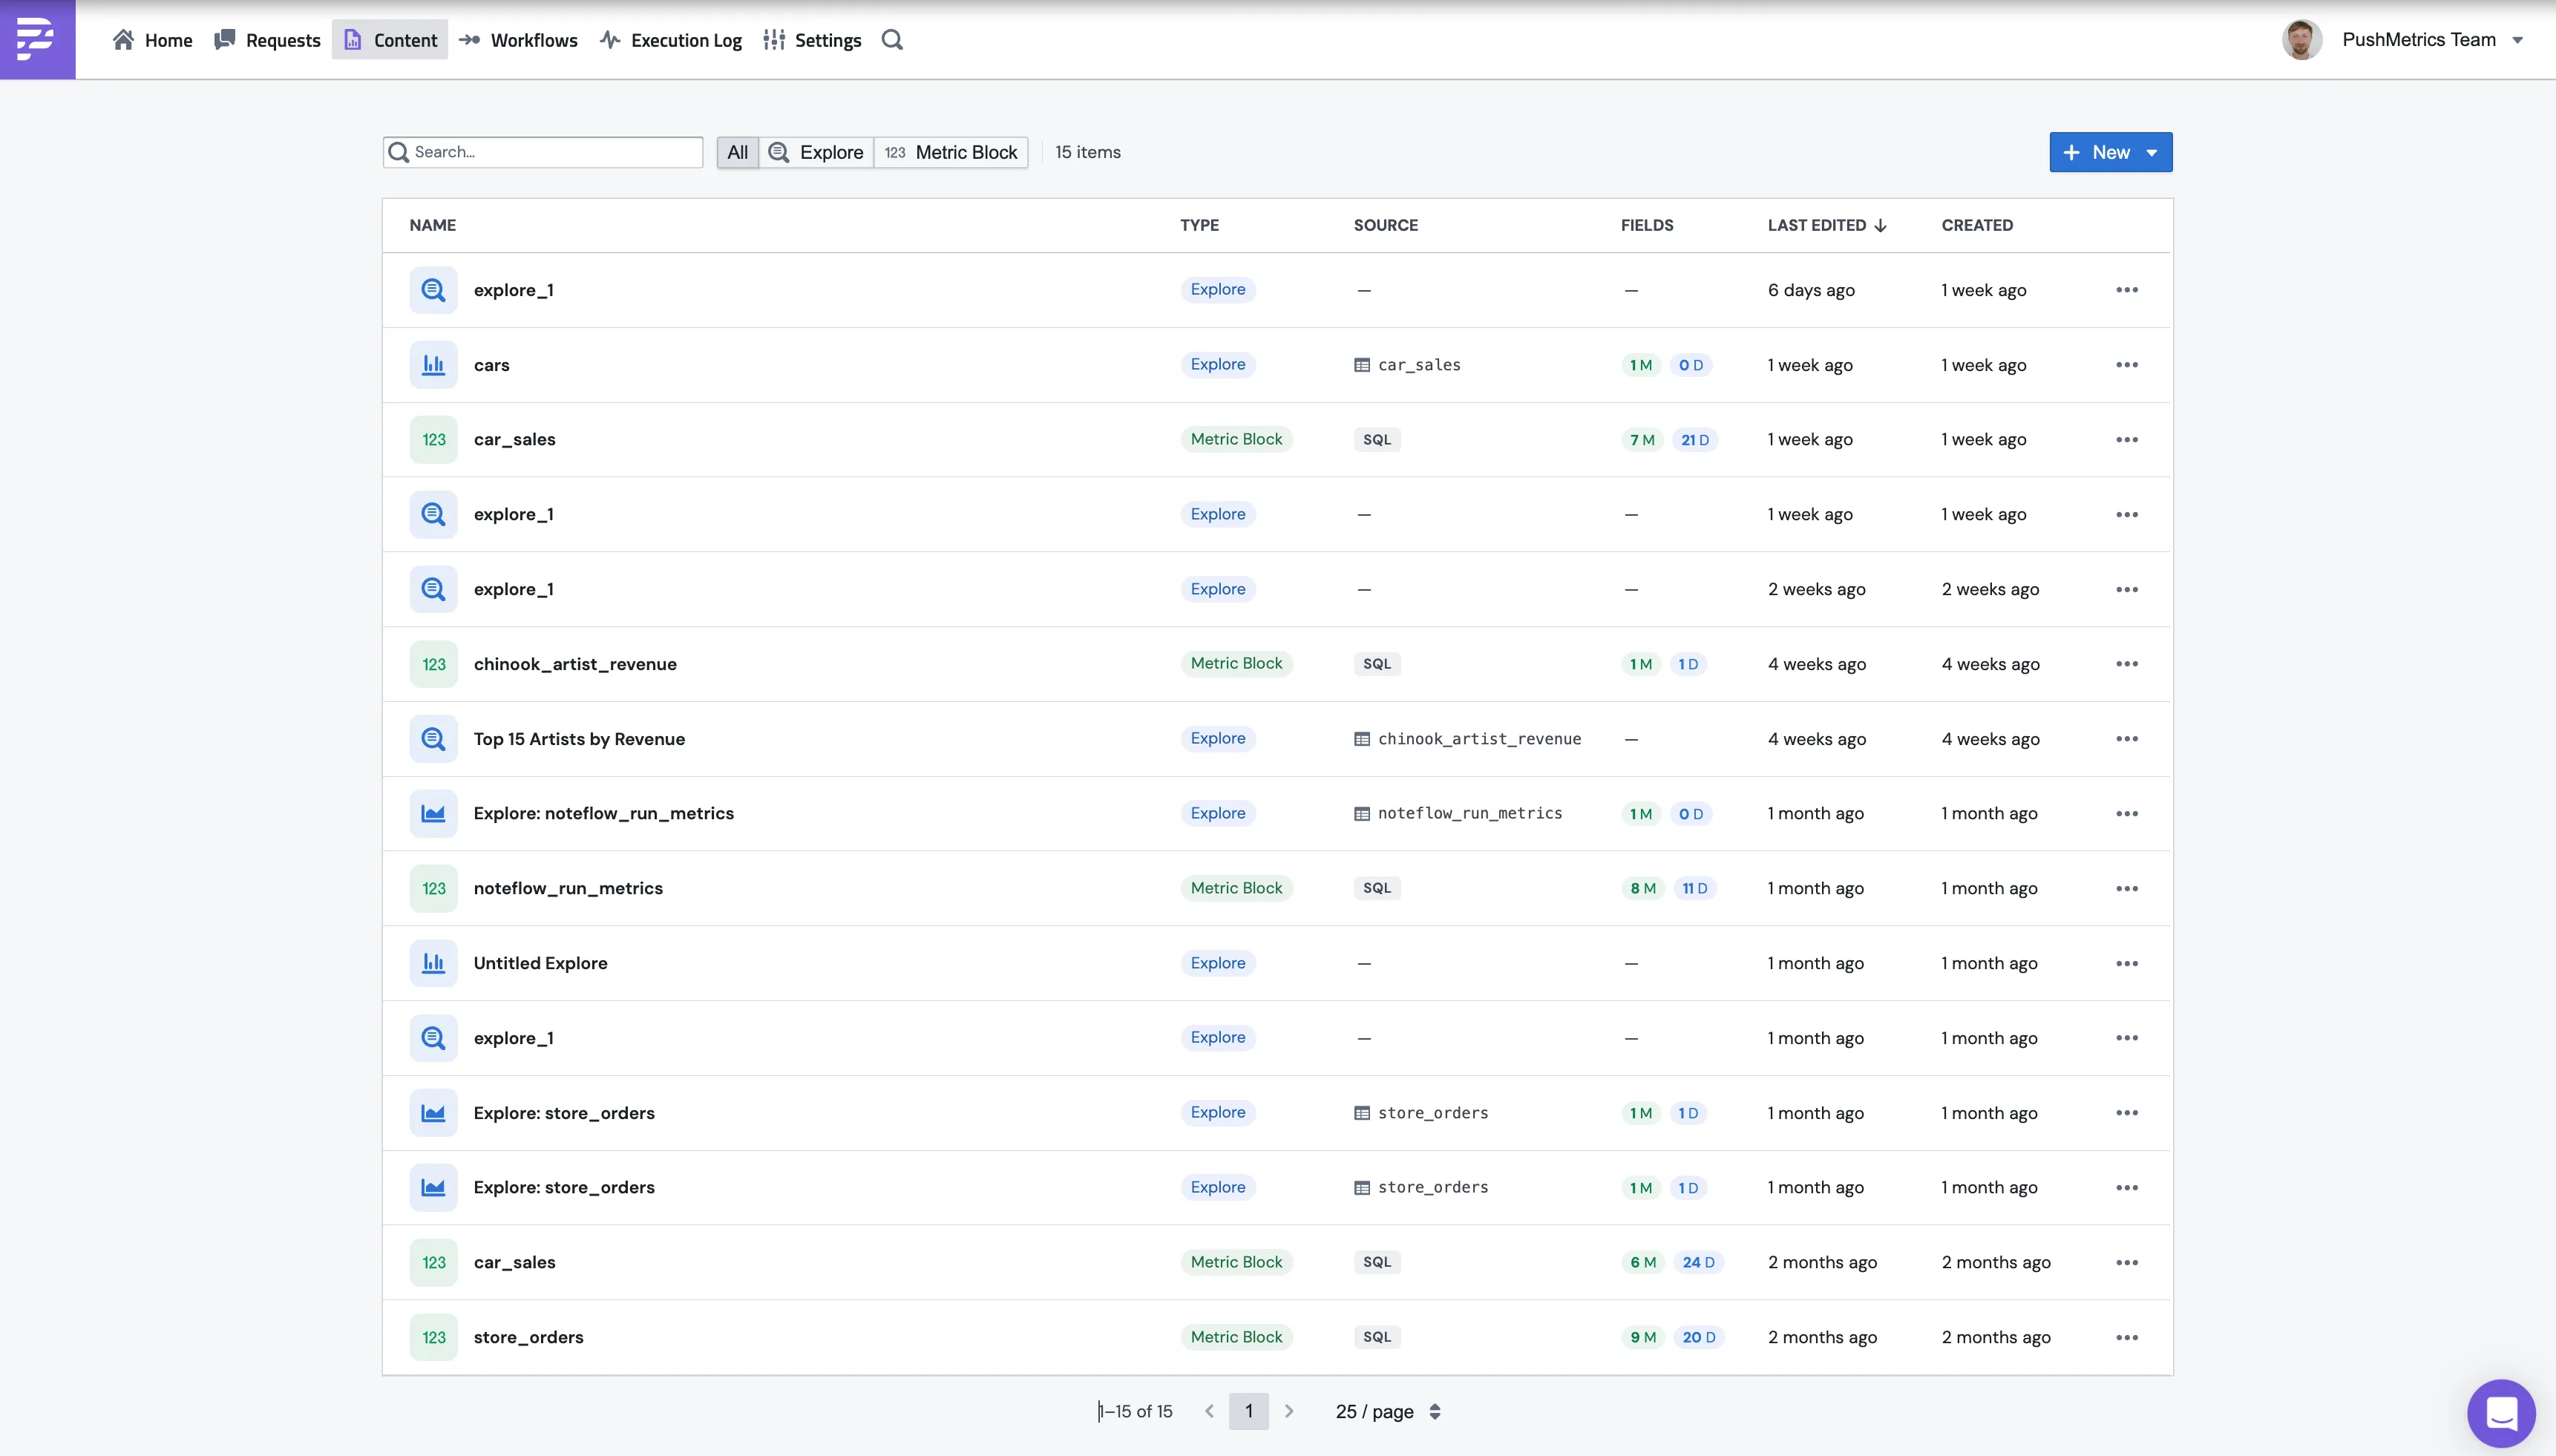
The Content page
Open Content from the top nav. You'll see a searchable list with these columns:
| Column | What it shows |
|---|---|
| Name | The name of the Metric Block or Explore |
| Type | Metric Block (green) or Explore (blue) |
| Source | For a Metric Block, the schema.table it reads or SQL for a custom query. For an Explore, the Metric Block it's anchored on |
| Fields | Field counts. M for measures, D for dimensions |
| Last edited | When it was last changed |
| Created | When it was first created |
Use the filter buttons at the top (All, Explore, Metric Block) to narrow the list, or the search box to find something by name.
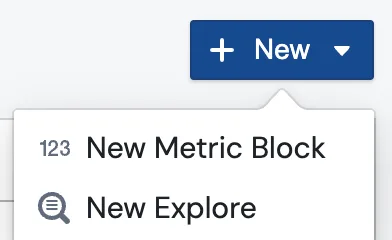
The + New button (top right) opens a menu with two options:
- New Metric Block to define a new data source
- New Explore to build a chart on an existing Metric Block
What is a Metric Block?
A Metric Block (also called a Metrics View inside the editor) is your team's definition of how a thing should be counted. You write one model query, list the measures (sums, averages, counts), and list the dimensions you want to slice by. After that, anyone in the workspace, and any AI agent, can ask questions against it without rewriting the SQL.
We built this because metric definitions drift. "Active users" tends to mean five different things across five different conversations. A Metric Block fixes the definition in one place, so every chart, report, and chat answer reads from that same place.
A Metric Block has these parts:
SELECT that returns the raw rows you want to measure, for example SELECT * FROM demo_data.car_sales. This is the table that every measure and dimension is built on.COUNT(*), SUM(price), or AVG(price). Each one has a name, an expression, a display name, and a format.car_make, car_model, order_date, or city.order_date) that powers time ranges and "by month" or "by week" grouping in Explore.{{ start_date }}, filled in at query time.Creating a Metric Block
You can build one yourself, or let PushMetrics auto-generate a starter set and review it.
- Table points at a schema and table directly. PushMetrics writes the model SQL for you (
SELECT * FROM schema.table). - Custom SQL lets you paste your own query into the SQL box. Use this when you need joins, filters, or a shaped result set.
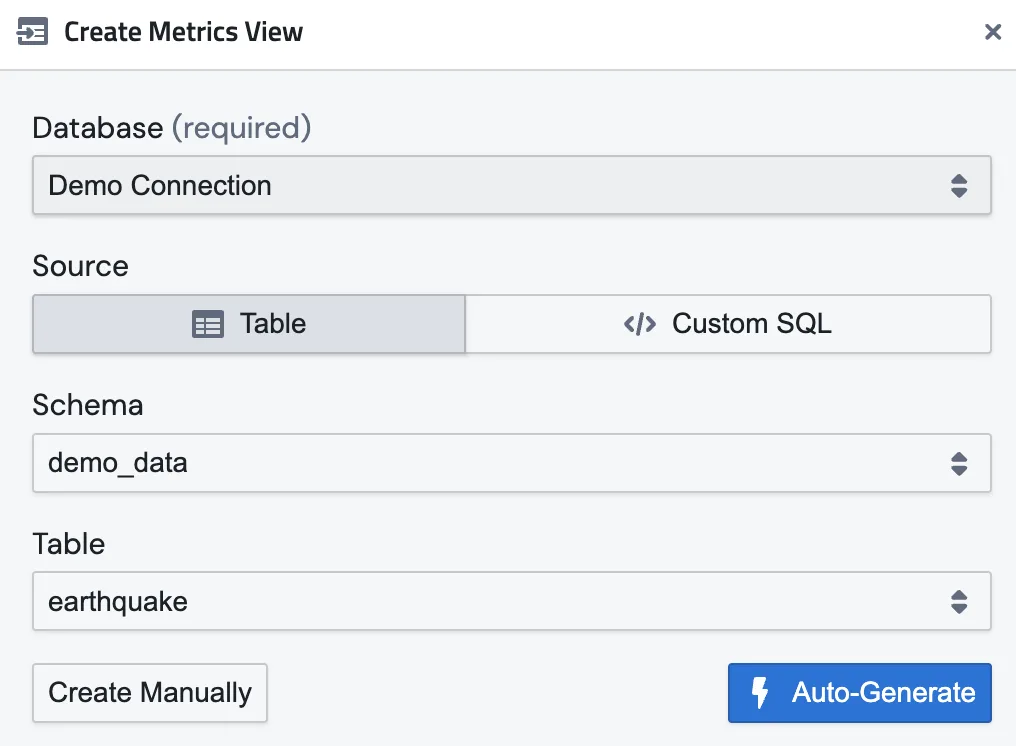
Auto-Generate vs Create Manually
- Auto-Generate runs your query, reads the columns, and uses AI to suggest the measures (numbers) and dimensions (categories) automatically. It's the fastest way to a working block.
- Create Manually creates an empty block with just the model SQL, so you can define every measure and dimension yourself.
Inside the editor you'll find two more helpers next to the model:
- Detect Columns classifies the columns from your model by type (string, number, date) without calling the AI.
- Suggest with AI hands the model to the agent and asks it to draft a starter set of smart measures.
The approval workflow
Anything Auto-Generated or created by an AI agent starts life as a draft. You'll see a yellow banner at the top of the block:
This metrics view was created by AI and needs review. Approve it to make it available for use.
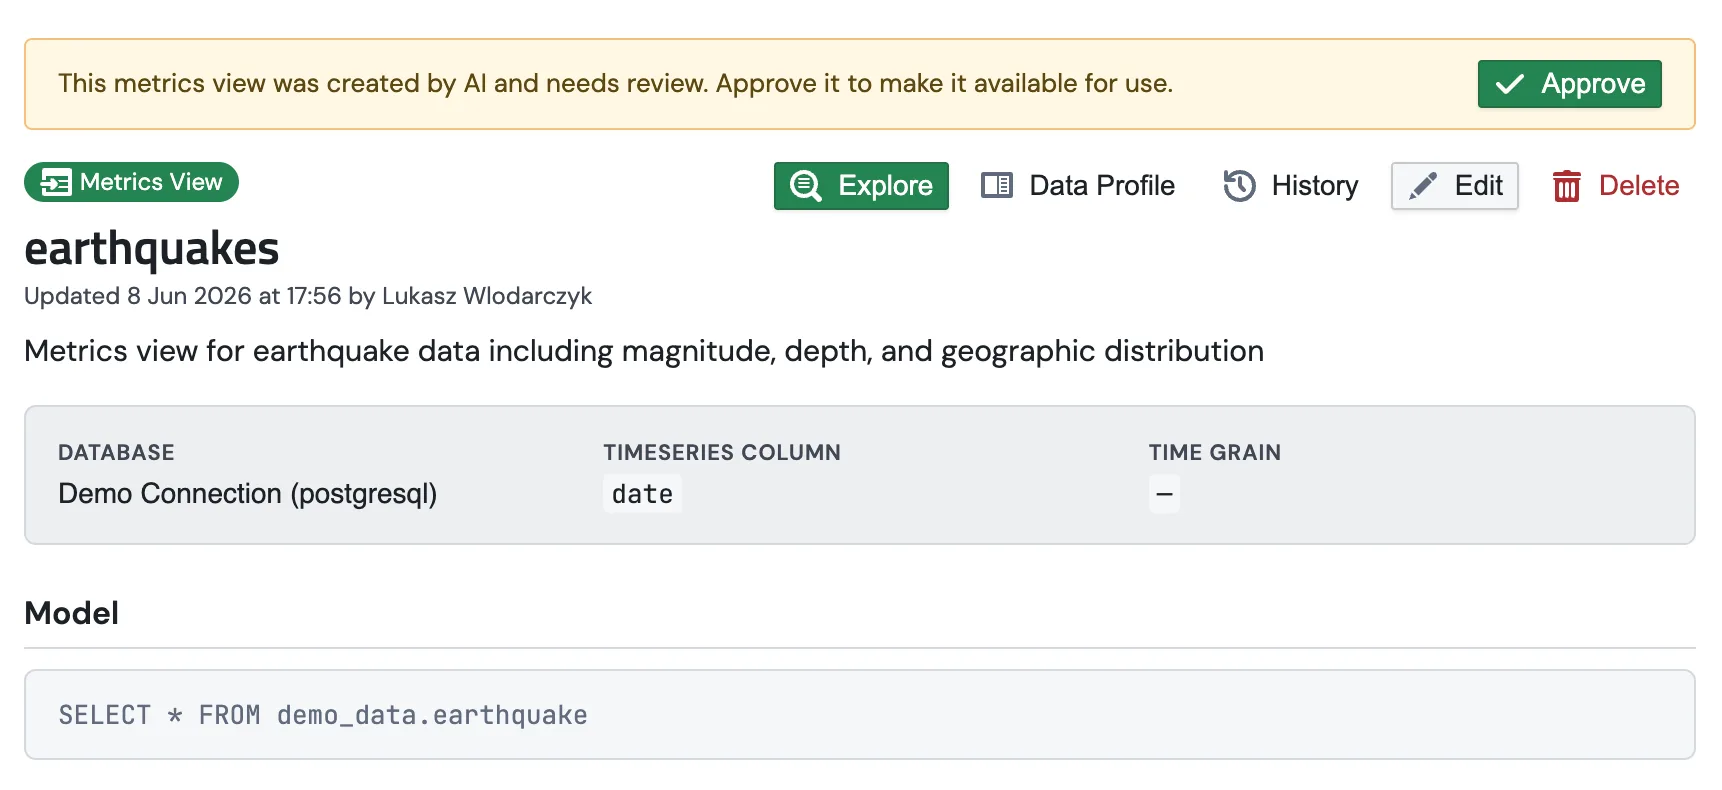
Review the measures and dimensions, fix anything that's off, then click Approve. Approving publishes the block so it can be used in Explores, reports, and by agents. This keeps AI-drafted definitions out of production until a human has signed off.
Anatomy of a Metric Block
Once created, the detail page shows everything in the block: the database and timeseries column, the model SQL, and tables of measures and dimensions.
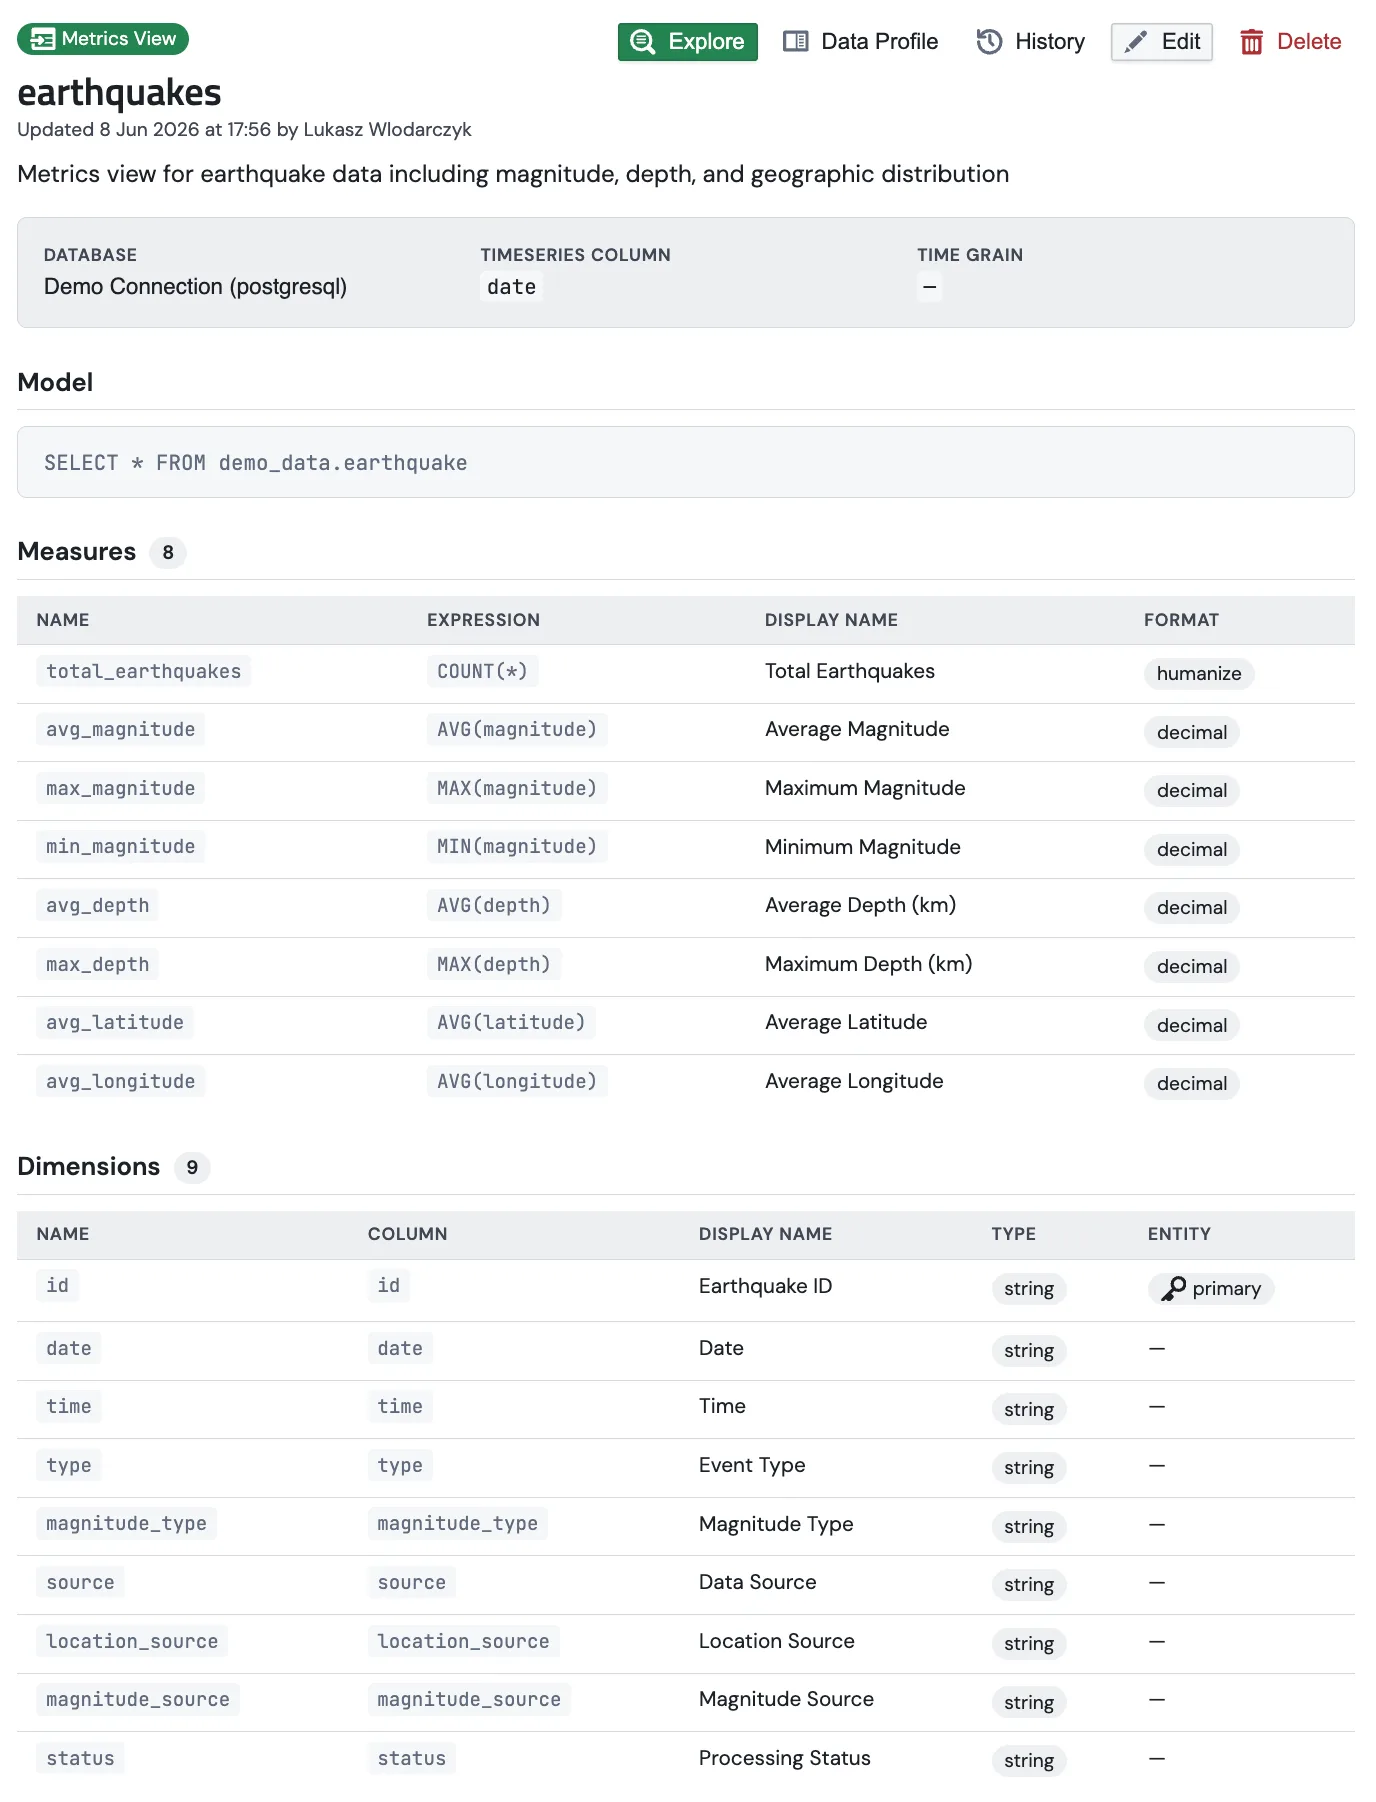
Measures
Each measure is a named SQL aggregate. For example, on a car_sales block:
| Name | Expression | Display name | Format |
|---|---|---|---|
total_sales |
COUNT(*) |
Total Sales | humanize |
total_revenue |
SUM(price) |
Total Revenue | currency_usd |
average_price |
AVG(price) |
Average Price | currency_usd |
new_cars_sold |
SUM(CASE WHEN is_new = true THEN 1 ELSE 0 END) |
New Cars Sold | humanize |
The format controls how the number renders everywhere it's shown. Available formats:
| Format | Example output |
|---|---|
humanize |
1.2K, 1.5M (smart rounding) |
number |
1,234,567 |
integer |
1,234 (no decimals) |
decimal |
1,234.56 |
percentage |
15.6% |
currency_usd |
$1,234.56 |
currency_eur |
€1,234.56 |
currency_gbp |
£1,234.56 |
interval_ms |
1h 1m (from milliseconds) |
bytes |
KB / MB / GB |
date |
date only |
datetime |
date + time |
Dimensions
Each dimension maps a column to a label and a type:
| Name | Column | Display name | Type |
|---|---|---|---|
order_date |
order_date |
Order Date | datetime |
car_make |
car_make |
Car Make | string |
car_model |
car_model |
Car Model | string |
Dimension type (string, number, boolean, time) tells Explore how to treat the field. For example, time dimensions get a grain selector (year, month, week, day) in the query builder.
That's your reusable data source. You can build many charts from one block.
Form view vs YAML view
The Metric Block editor has two synced views. Toggle YAML in the top right to switch.
- Form is the easiest way to start. It has fields for the model SQL, parameters, measures, and dimensions, with a format dropdown on each measure. Use it when you're figuring out what's possible.
- YAML shows the same definition as a single text document. Use it to copy a block into a code review, paste it into a doc, or check it into git.
Editing in either view and saving keeps the other in sync. The YAML format is also what the Upload Metrics .yaml import expects, so you can drop a file in and it becomes a new Metric Block.
Next steps
- Building Charts with Explore shows how to turn a Metric Block into a bar, line, table, or KPI card.
- Charts in Reports & Slack covers attaching a saved Explore to a report and delivering it as a PNG to Slack or email.