A metrics view is your team's definition of how a given thing should be counted. You write one model query, list the measures (sums, averages, counts), and list the dimensions you want to slice by. After that, anyone in the workspace can ask questions against it without rewriting the SQL, and the agent can do the same.
We built this because metric definitions drift. "Active users" tends to mean five different things across five different conversations. A metrics view fixes the definition in one place, and every chart, report, and chat answer reads from that same place.
Where to find them
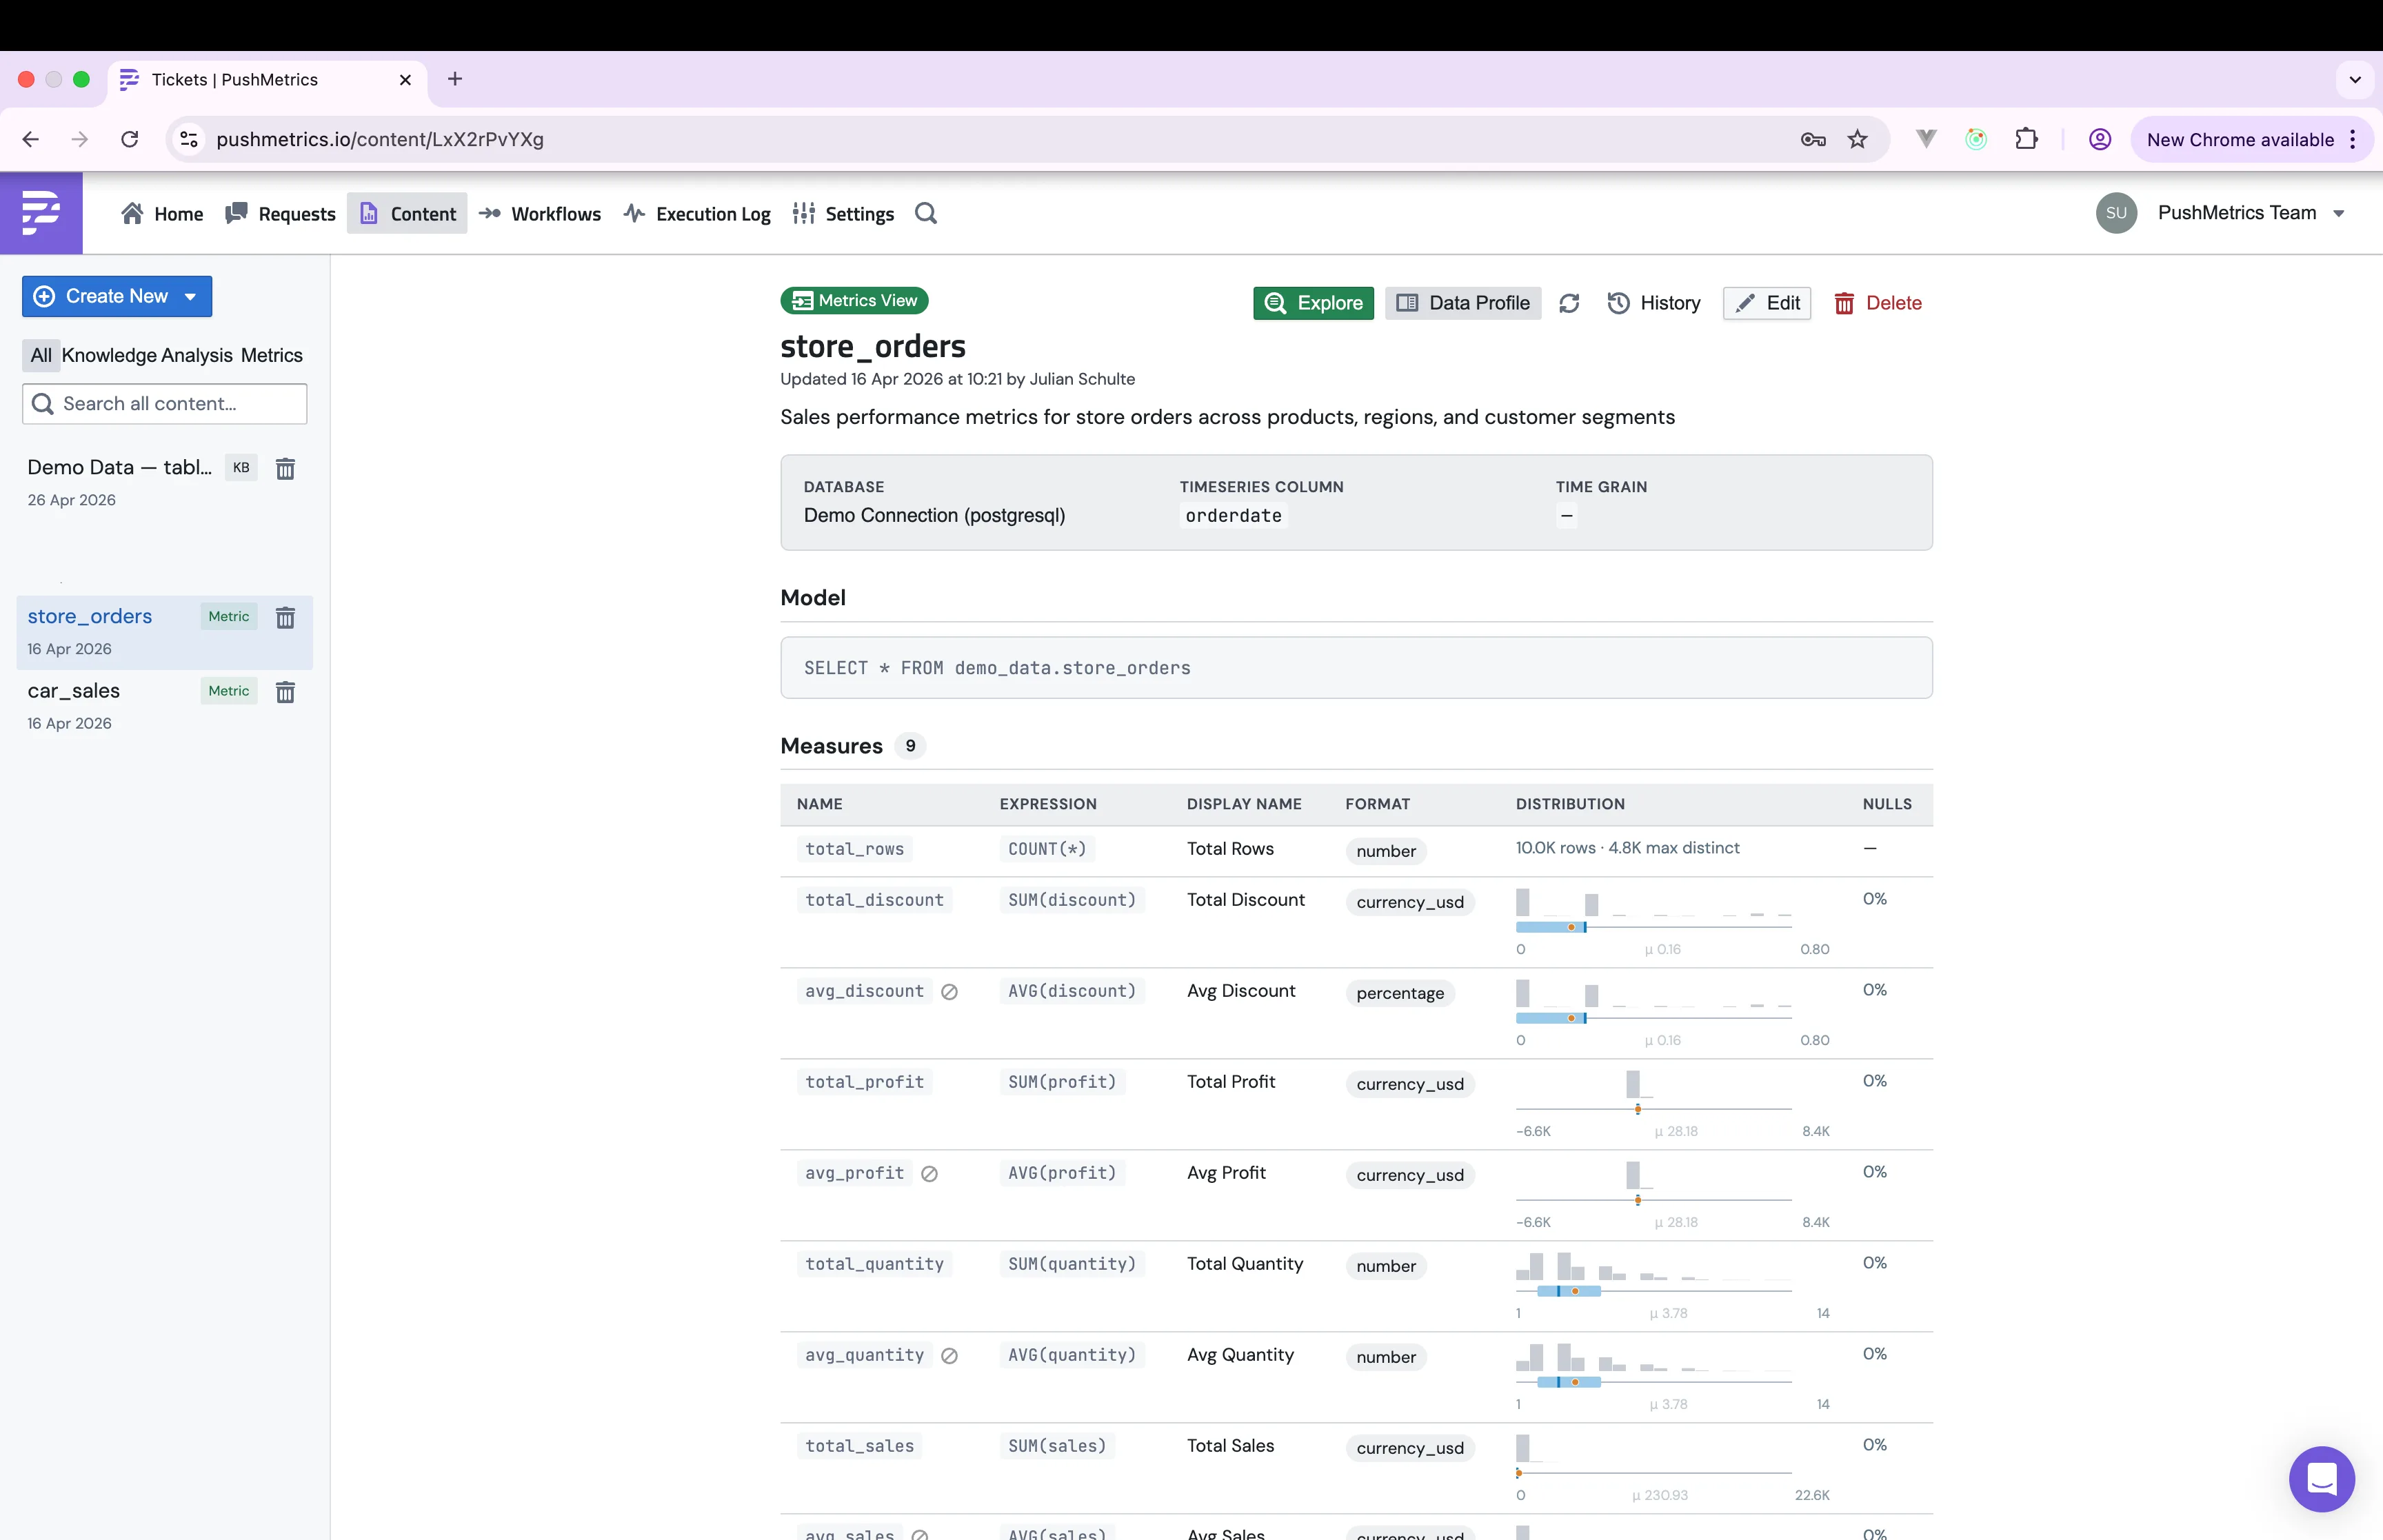
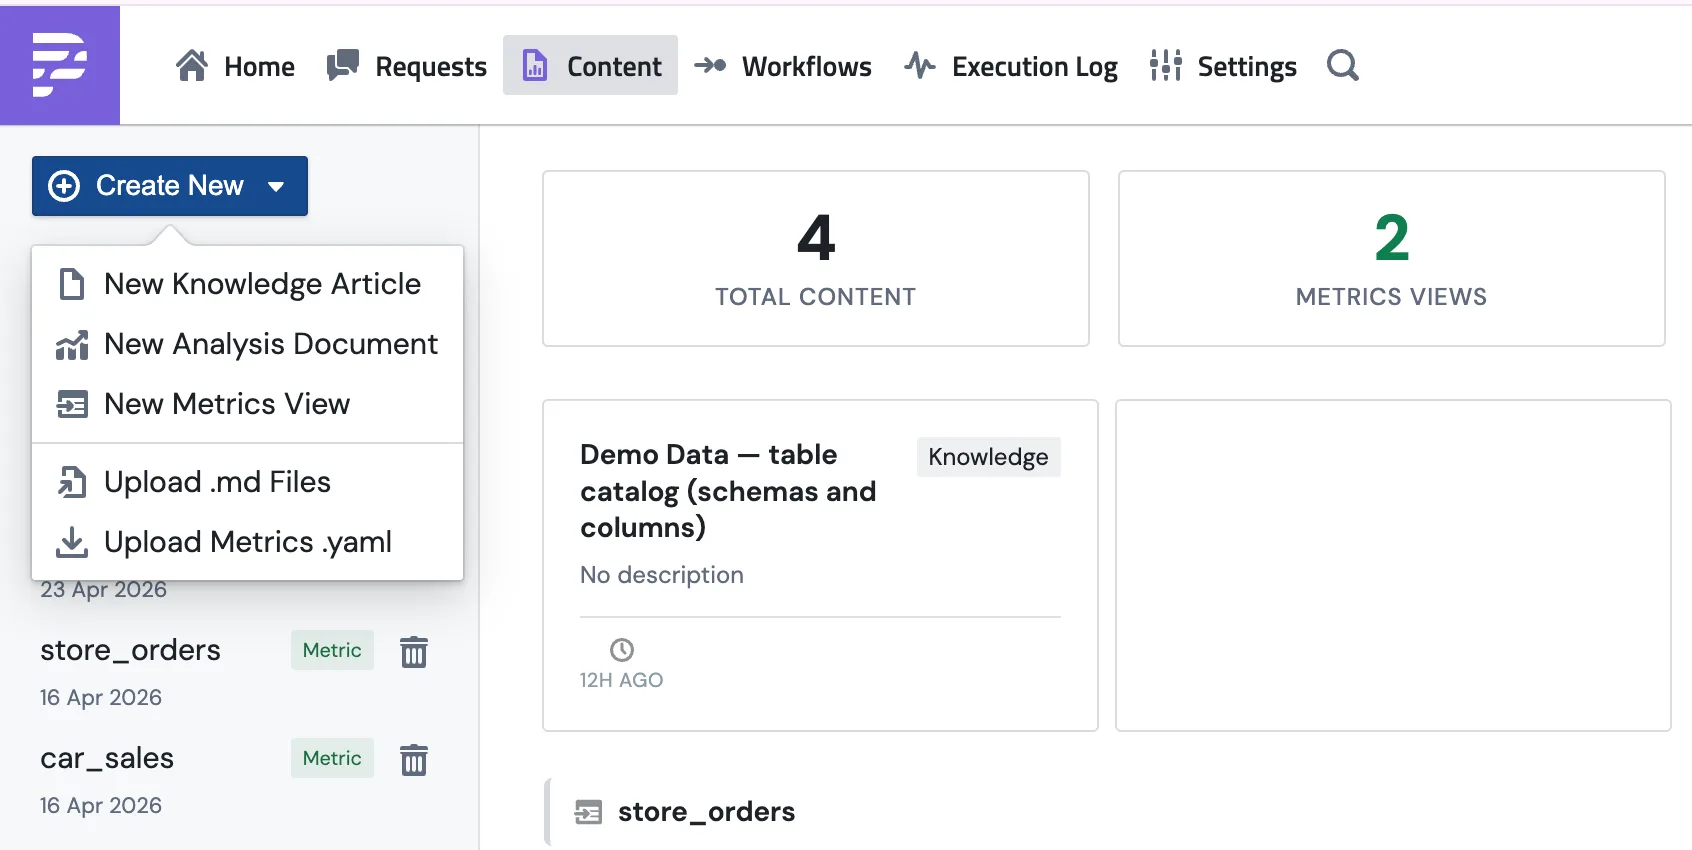
Metrics views live in Content in the top nav. Filter the list by Metric Block to see just the views, or by Explore to see saved explorations. The Content page is the single home for everything queryable in your workspace.
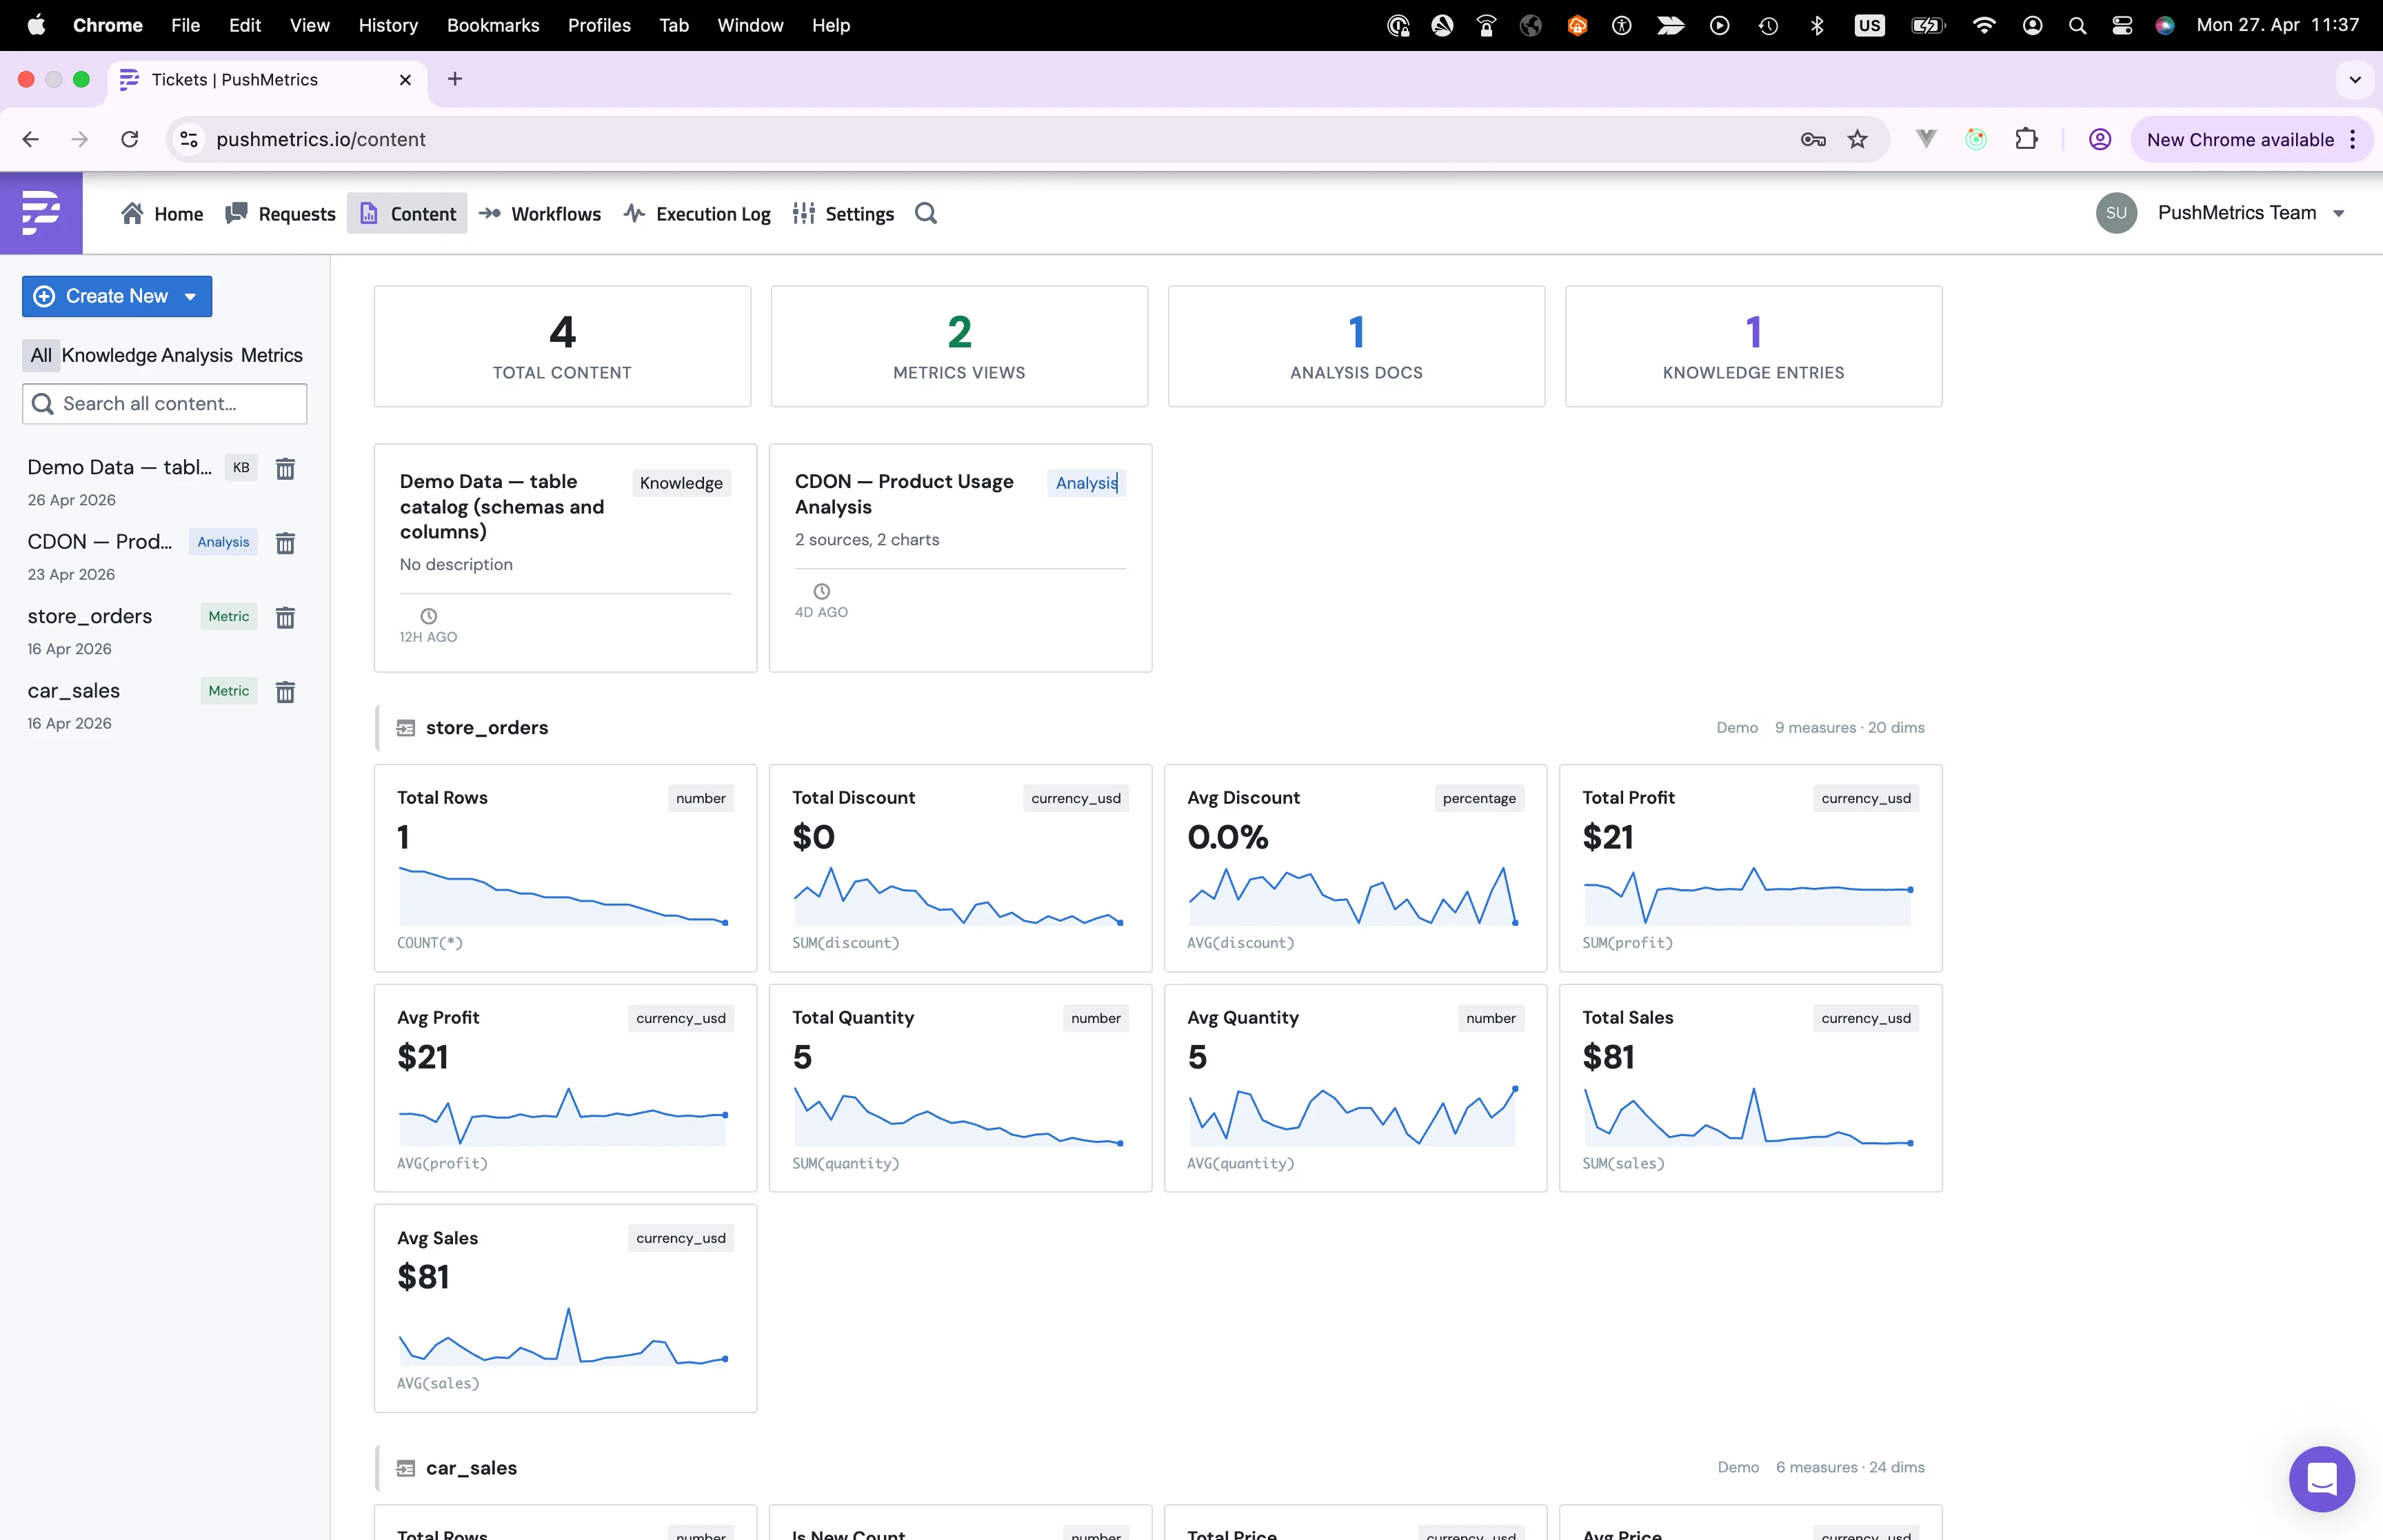
Click into a view and you'll see its measures, dimensions, and a sparkline next to each measure showing the distribution of values.
Creating a metrics view
You can build one yourself, or ask the agent to draft it and review what it came up with.
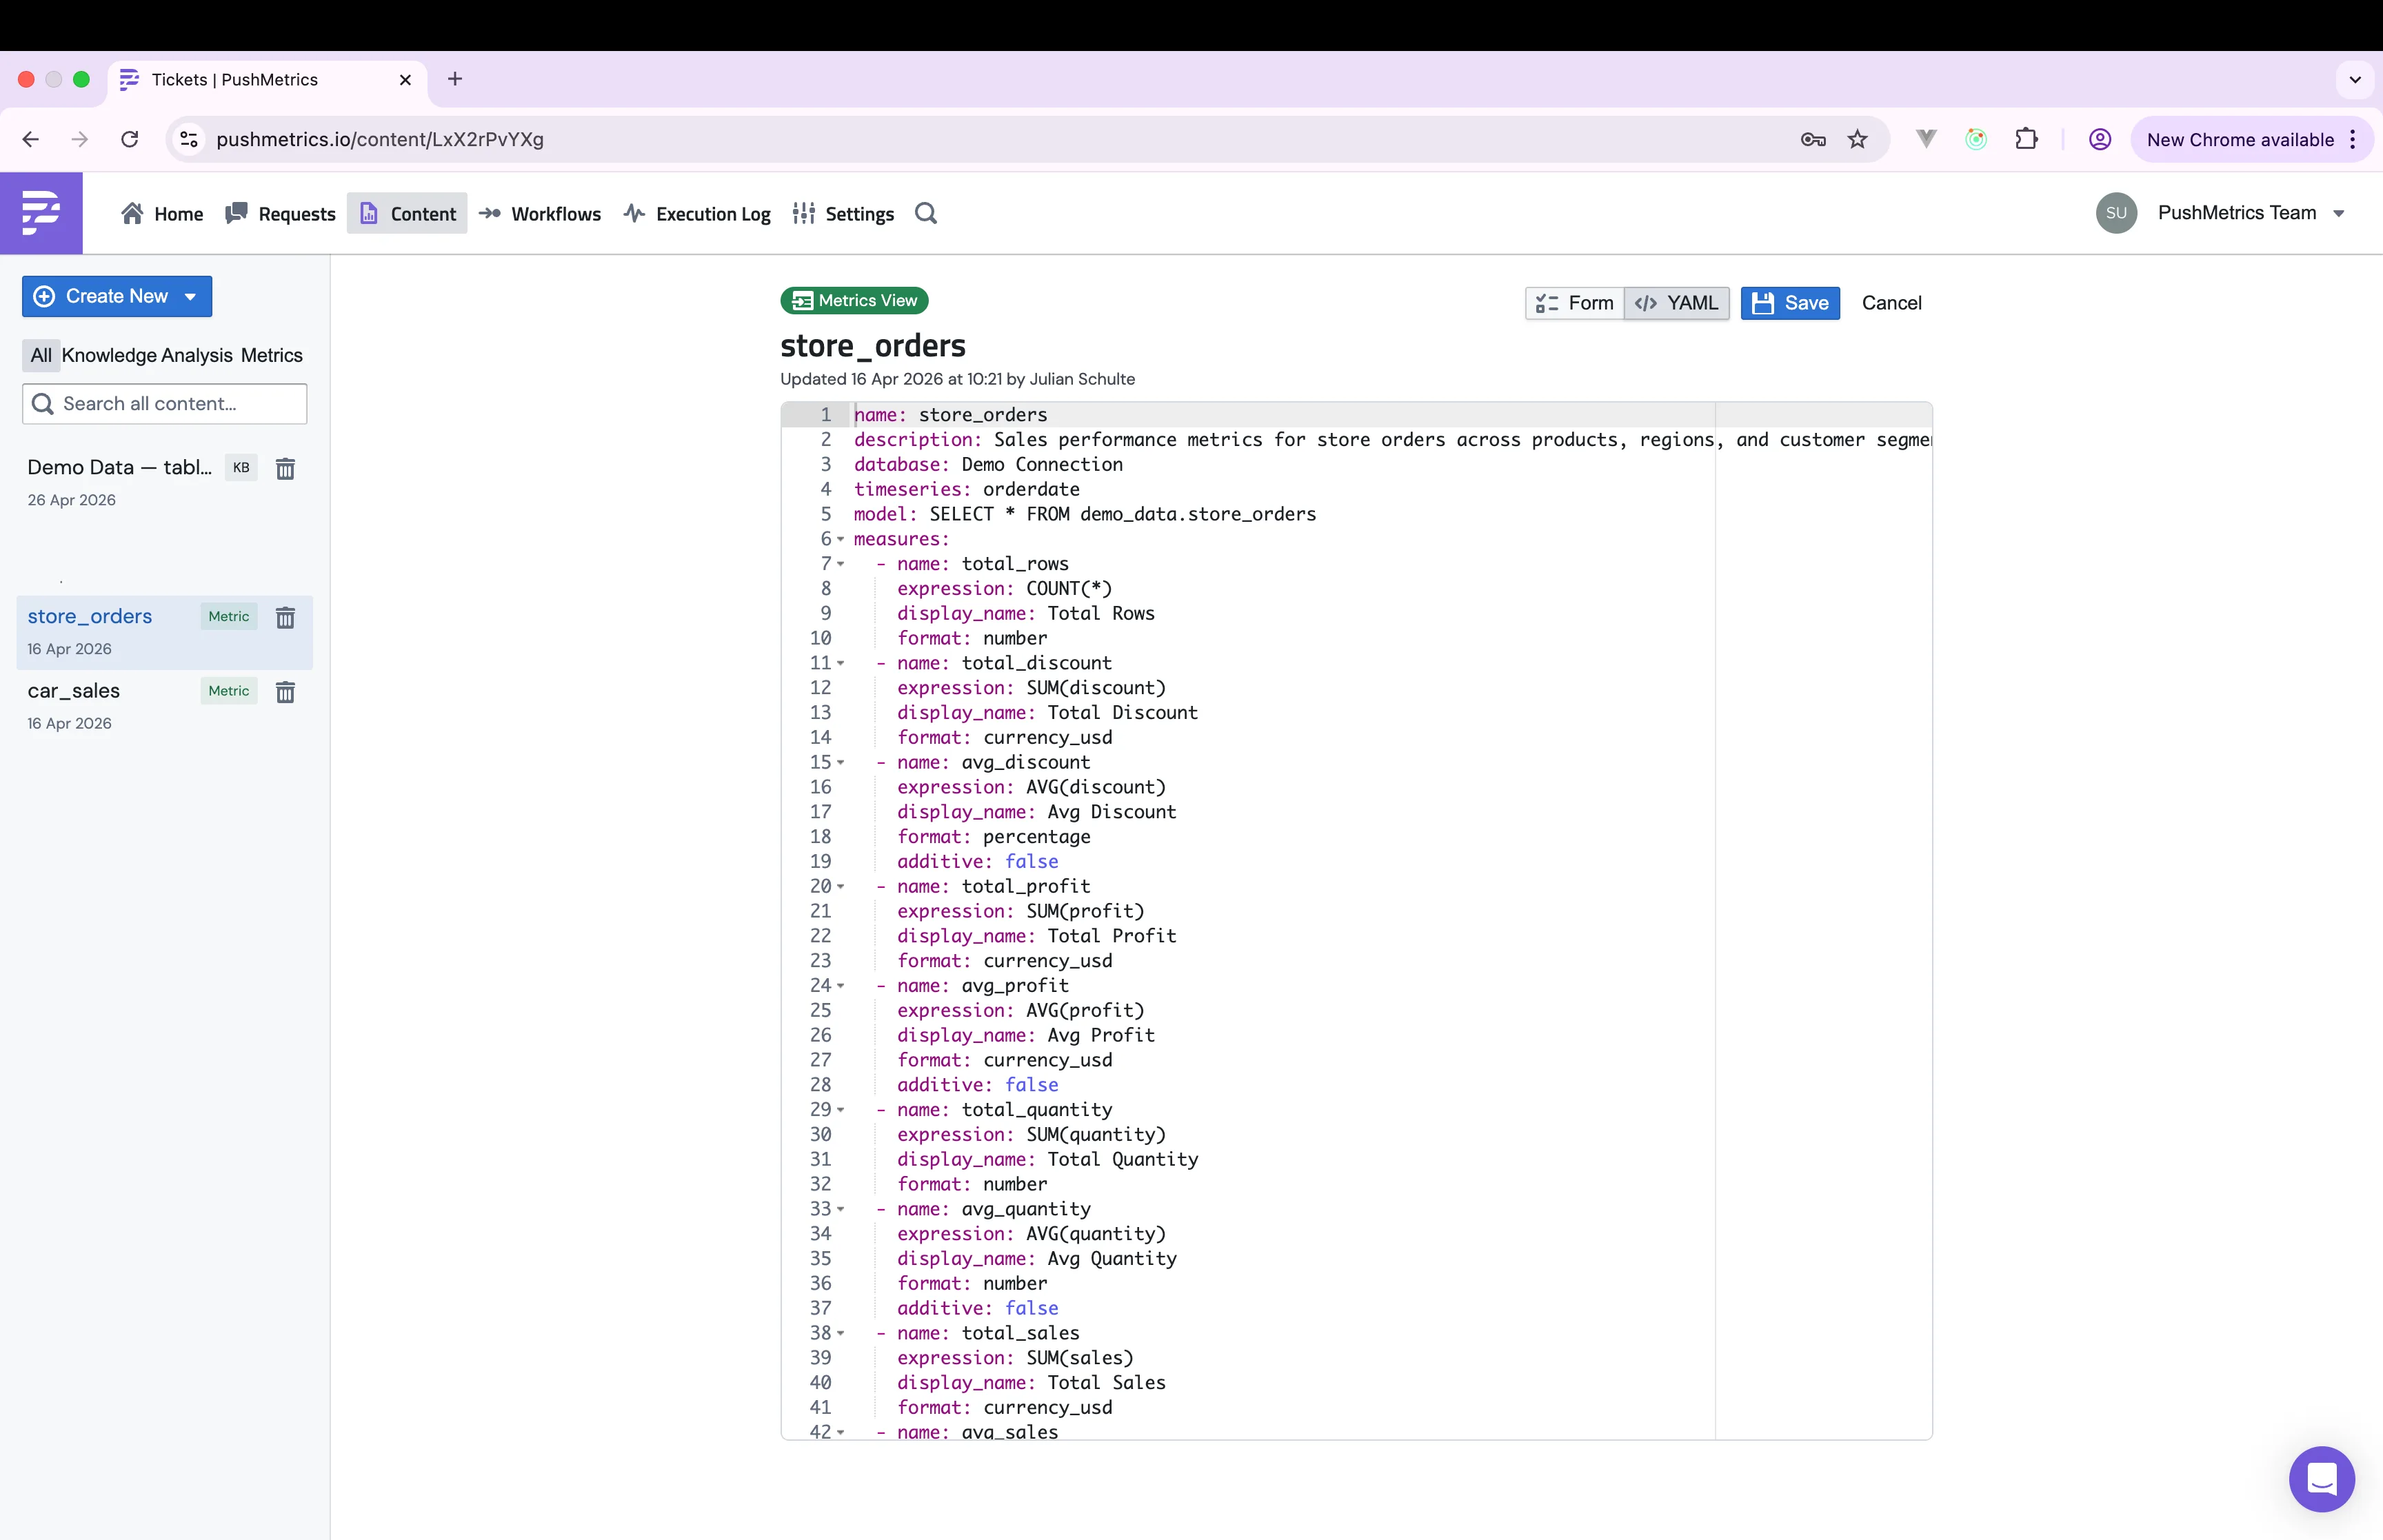
SELECT that returns the rows you want to measure.The form view
The form is the easiest way to start. There are fields for the model SQL, parameters, measures, and dimensions, with a format column on each measure for things like number, currency, or percentage.
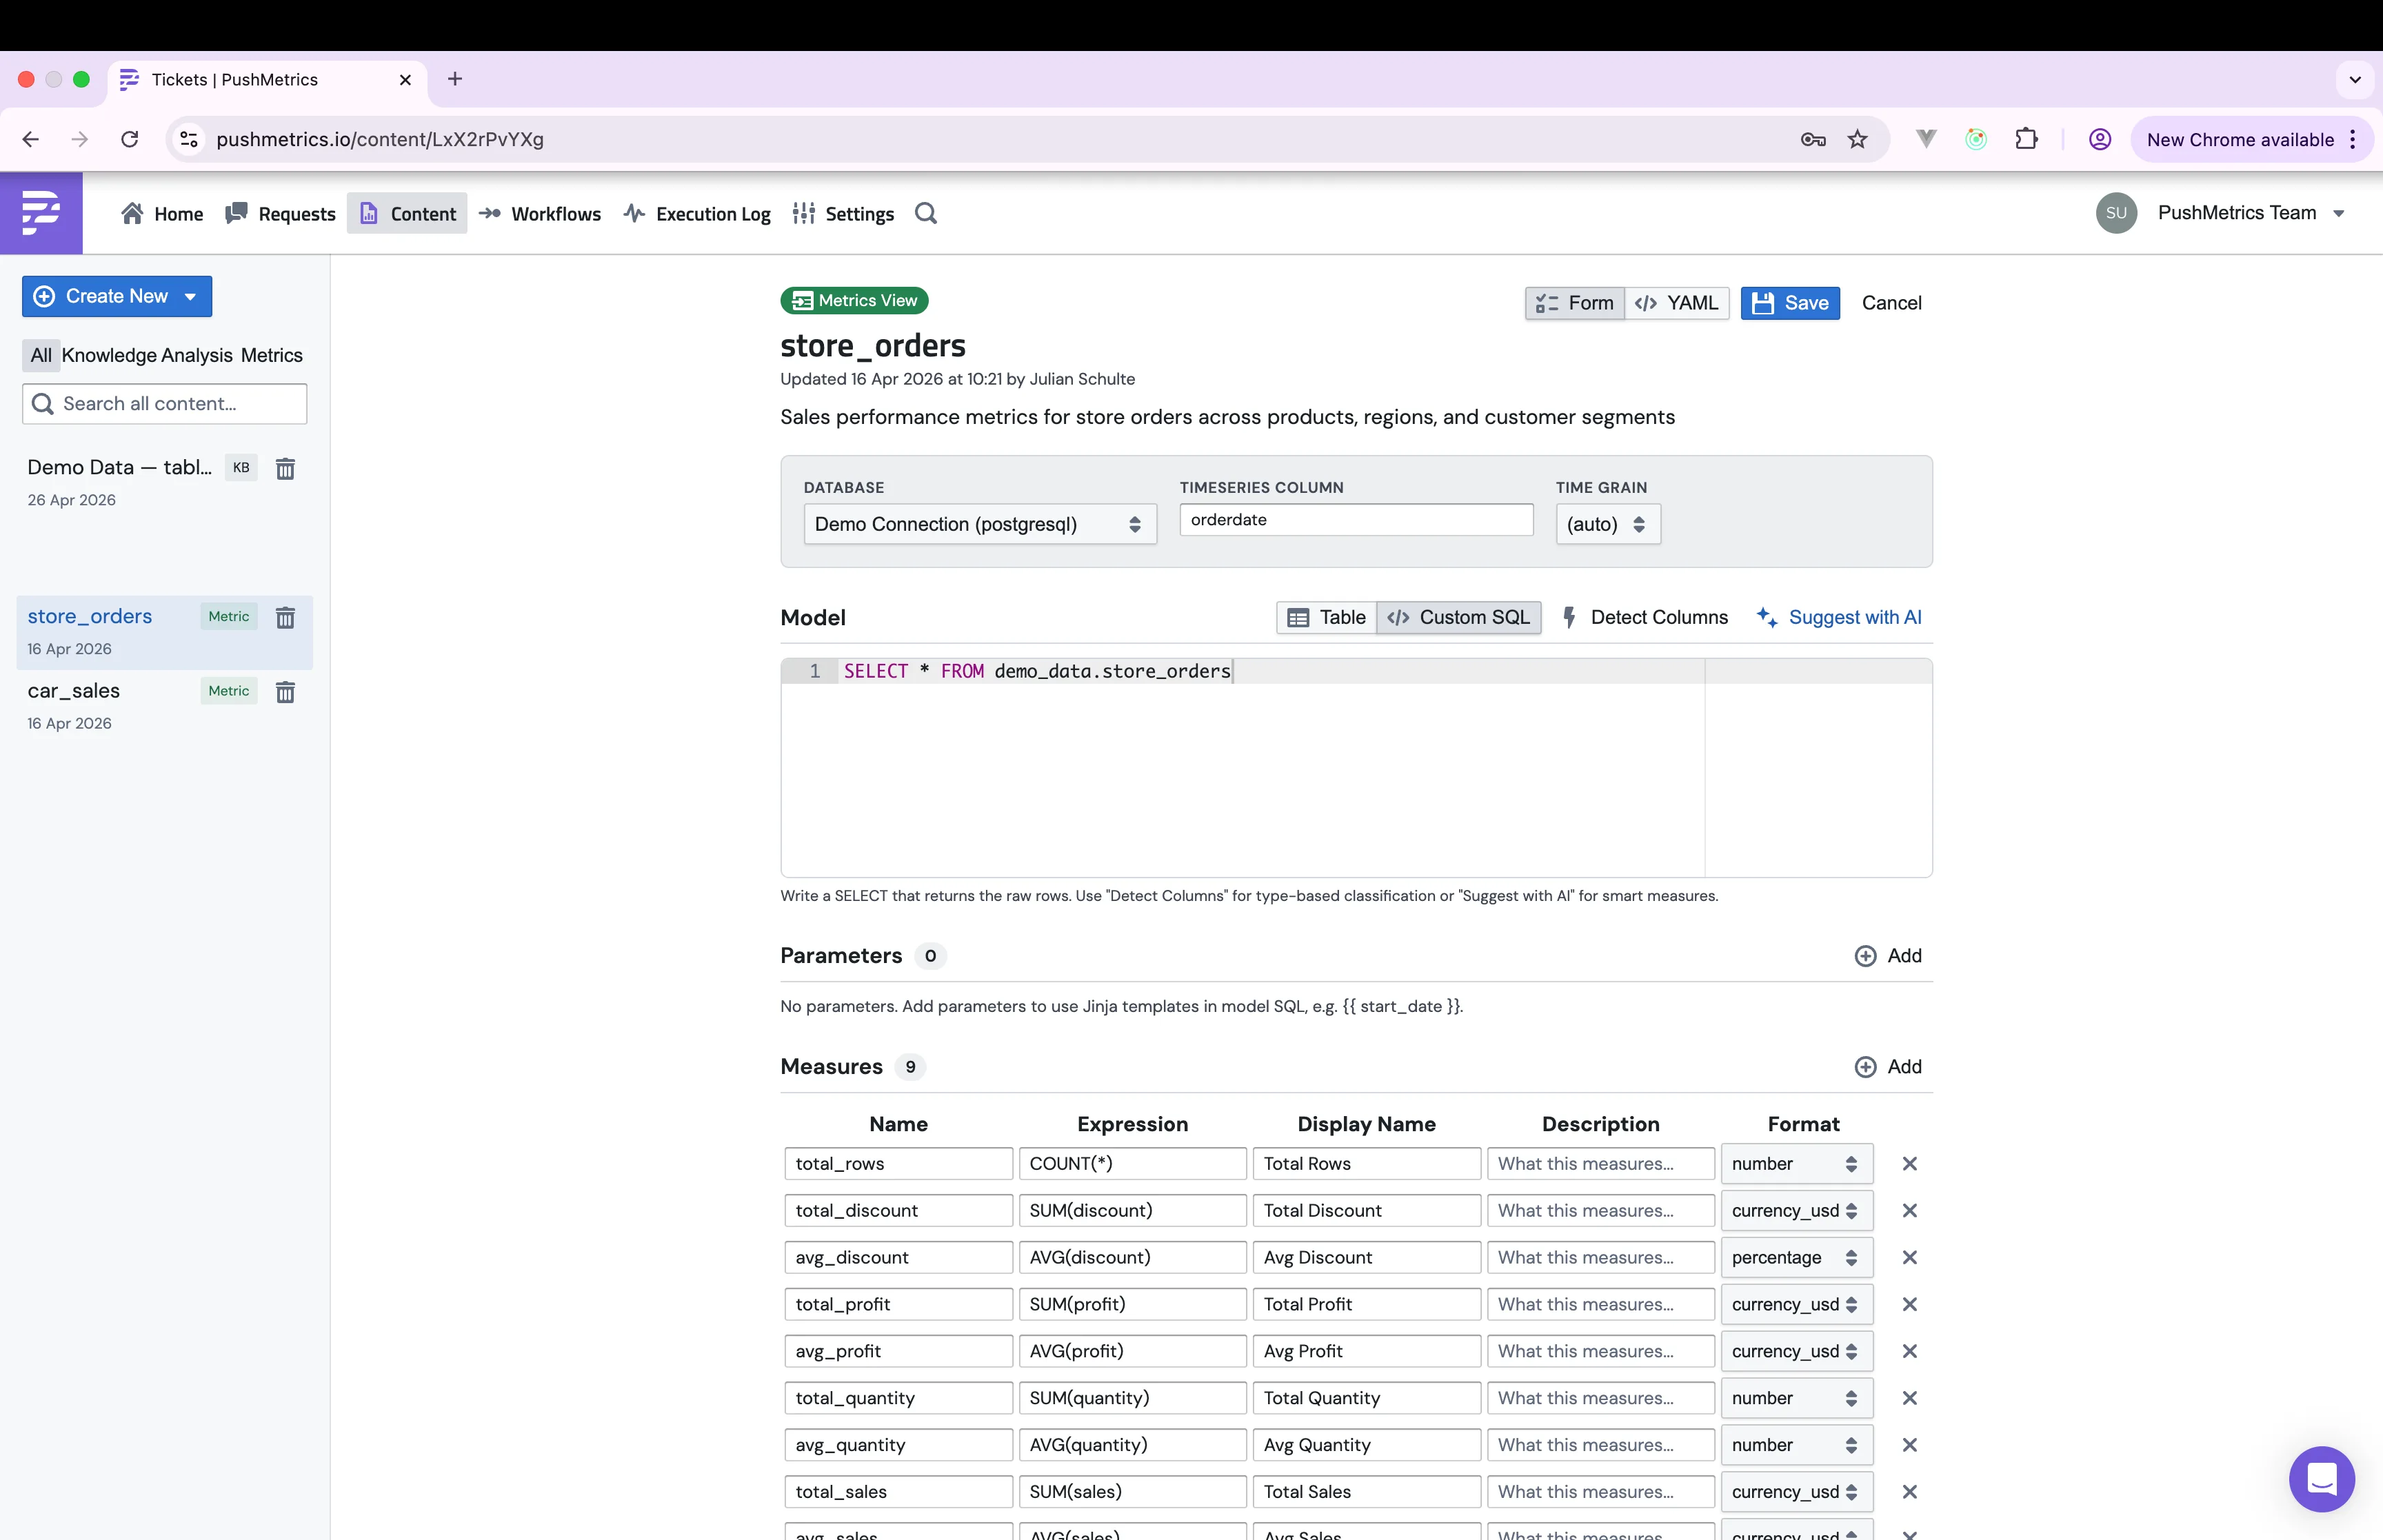
A few things to know about the fields:
- Measures are SQL aggregate expressions like
COUNT(*),SUM(discount), orAVG(profit). Each one needs a shortname(used inside queries) and adisplay_name(the label shown in the UI). - Dimensions are columns from the model that you want to group or filter by. Things like
city,country,category, ororderdate. - Parameters let the model query use Jinja templates, for example
{{ start_date }}. The agent fills them in when it queries the view. - Format controls how a measure renders. Options include
number,currency_usd,percentage, and a few more.
The YAML view
Toggle YAML in the top right and the same definition appears as a single text document. This is handy if you want to copy a view into a code review, paste it into a doc, or version it in git.
The YAML format is also what Upload Metrics .yaml expects. Drop a file in and it gets imported as a new metrics view. No clicking through the form.
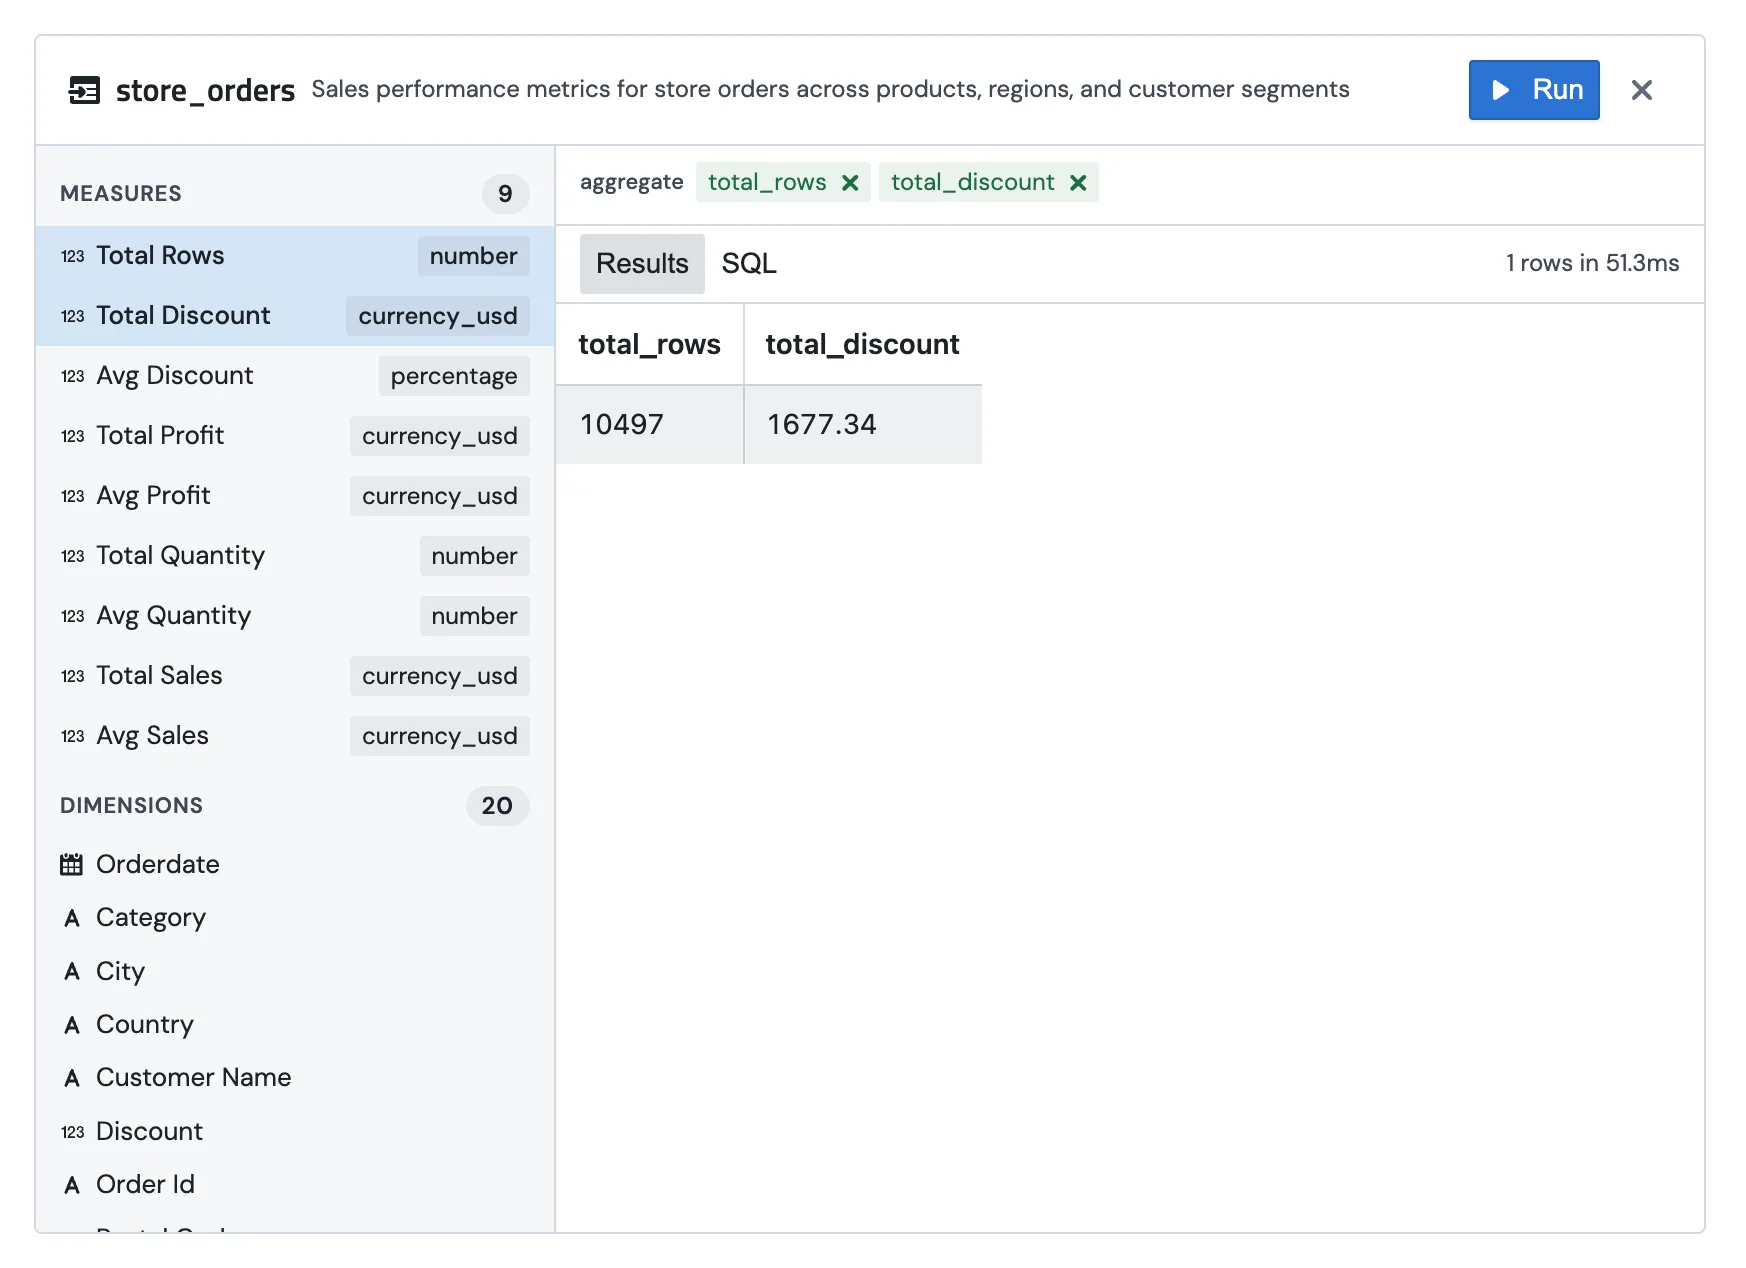
Exploring a metrics view
Click Explore on any saved metrics view to open the explorer. Pick measures from the list on the left, optionally pick a dimension to group by, and hit Run.
Add a dimension and you get the breakdown:
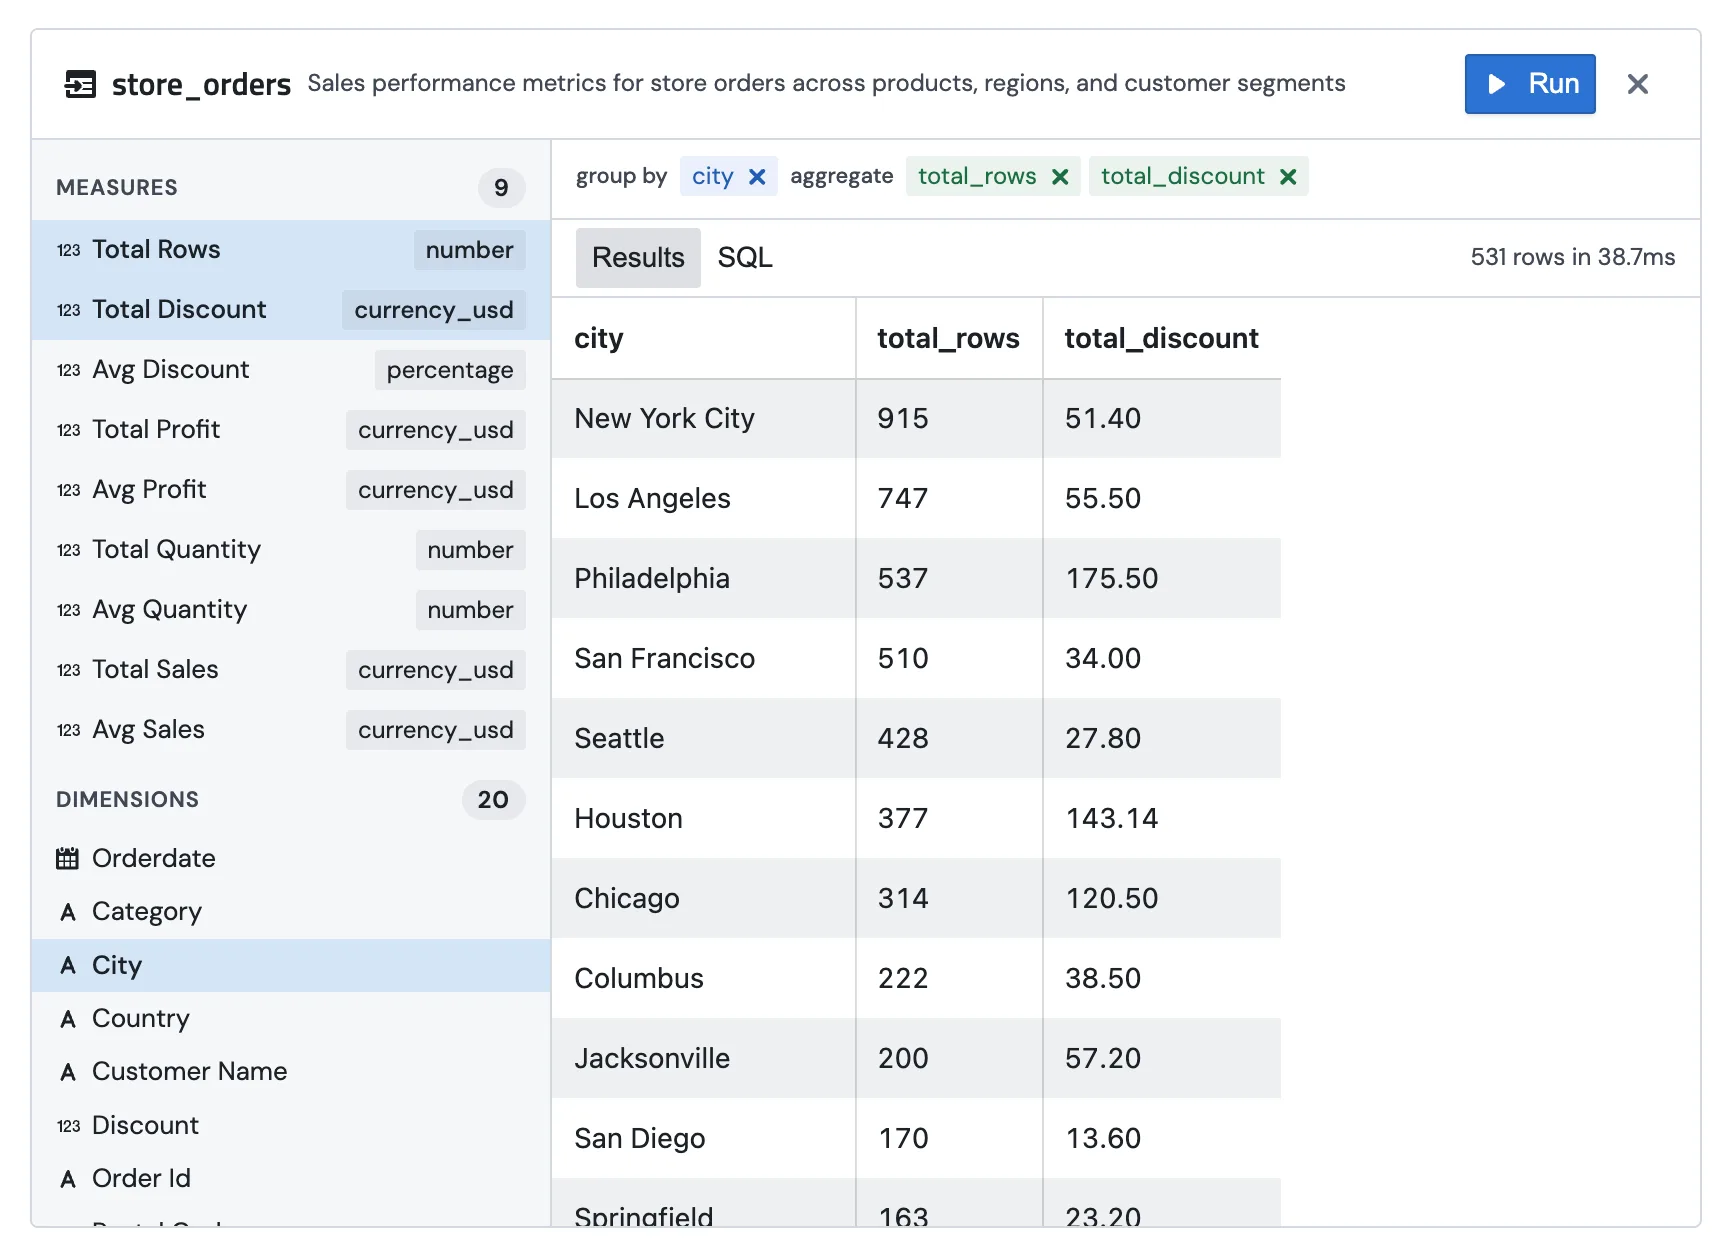
Behind the scenes, the explorer compiles your selections into a single SQL query against the model, runs it, and shows the result. If you want to see the actual SQL that ran, click the SQL tab next to the results.
How agents use them
Metrics views are workspace-wide, so any agent can see them. In a chat the agent can:
- List the views to find one that fits the question.
- Read a view to see what measures and dimensions are available.
- Query a view by picking measures and dimensions, then use the result in its answer.
- Suggest a new view when it notices the same calculation getting reinvented across conversations.
Because measures and dimensions have names, the agent doesn't need to write SQL from scratch. A question like "how many active users in March, by country" turns into a single call: pick the active_users measure, group by country, filter the time range. The numbers come back the same way every time.
What to put in a view
Anything where the definition matters and gets used more than once.
ARR, MRR, active users, conversion rate, churn. The numbers leadership cares about.
One view per "thing" you ask questions about: orders, users, sessions, tickets.
Anything you've written the same SQL for more than twice. Promote it to a measure and stop retyping it.
"Excludes test accounts", "fiscal year starts in April". Encode the rule once instead of explaining it every time.
Metrics view or memory?
These two storage spots both hold know-how, but they do different jobs.
If the definition needs to actually run against the database, it belongs in a metrics view. If it's a rule or template specific to one agent's job, put it in memory.