Once you've built an Explore, you can drop it into a report as a chart image and have PushMetrics deliver it on a schedule, to Slack, email, or anywhere else a report can go. The report renders the chart fresh each run, so the image is always up to date.
This is the third piece of the workflow:
Attach an Explore to a report
1
Open or create a Report.
2
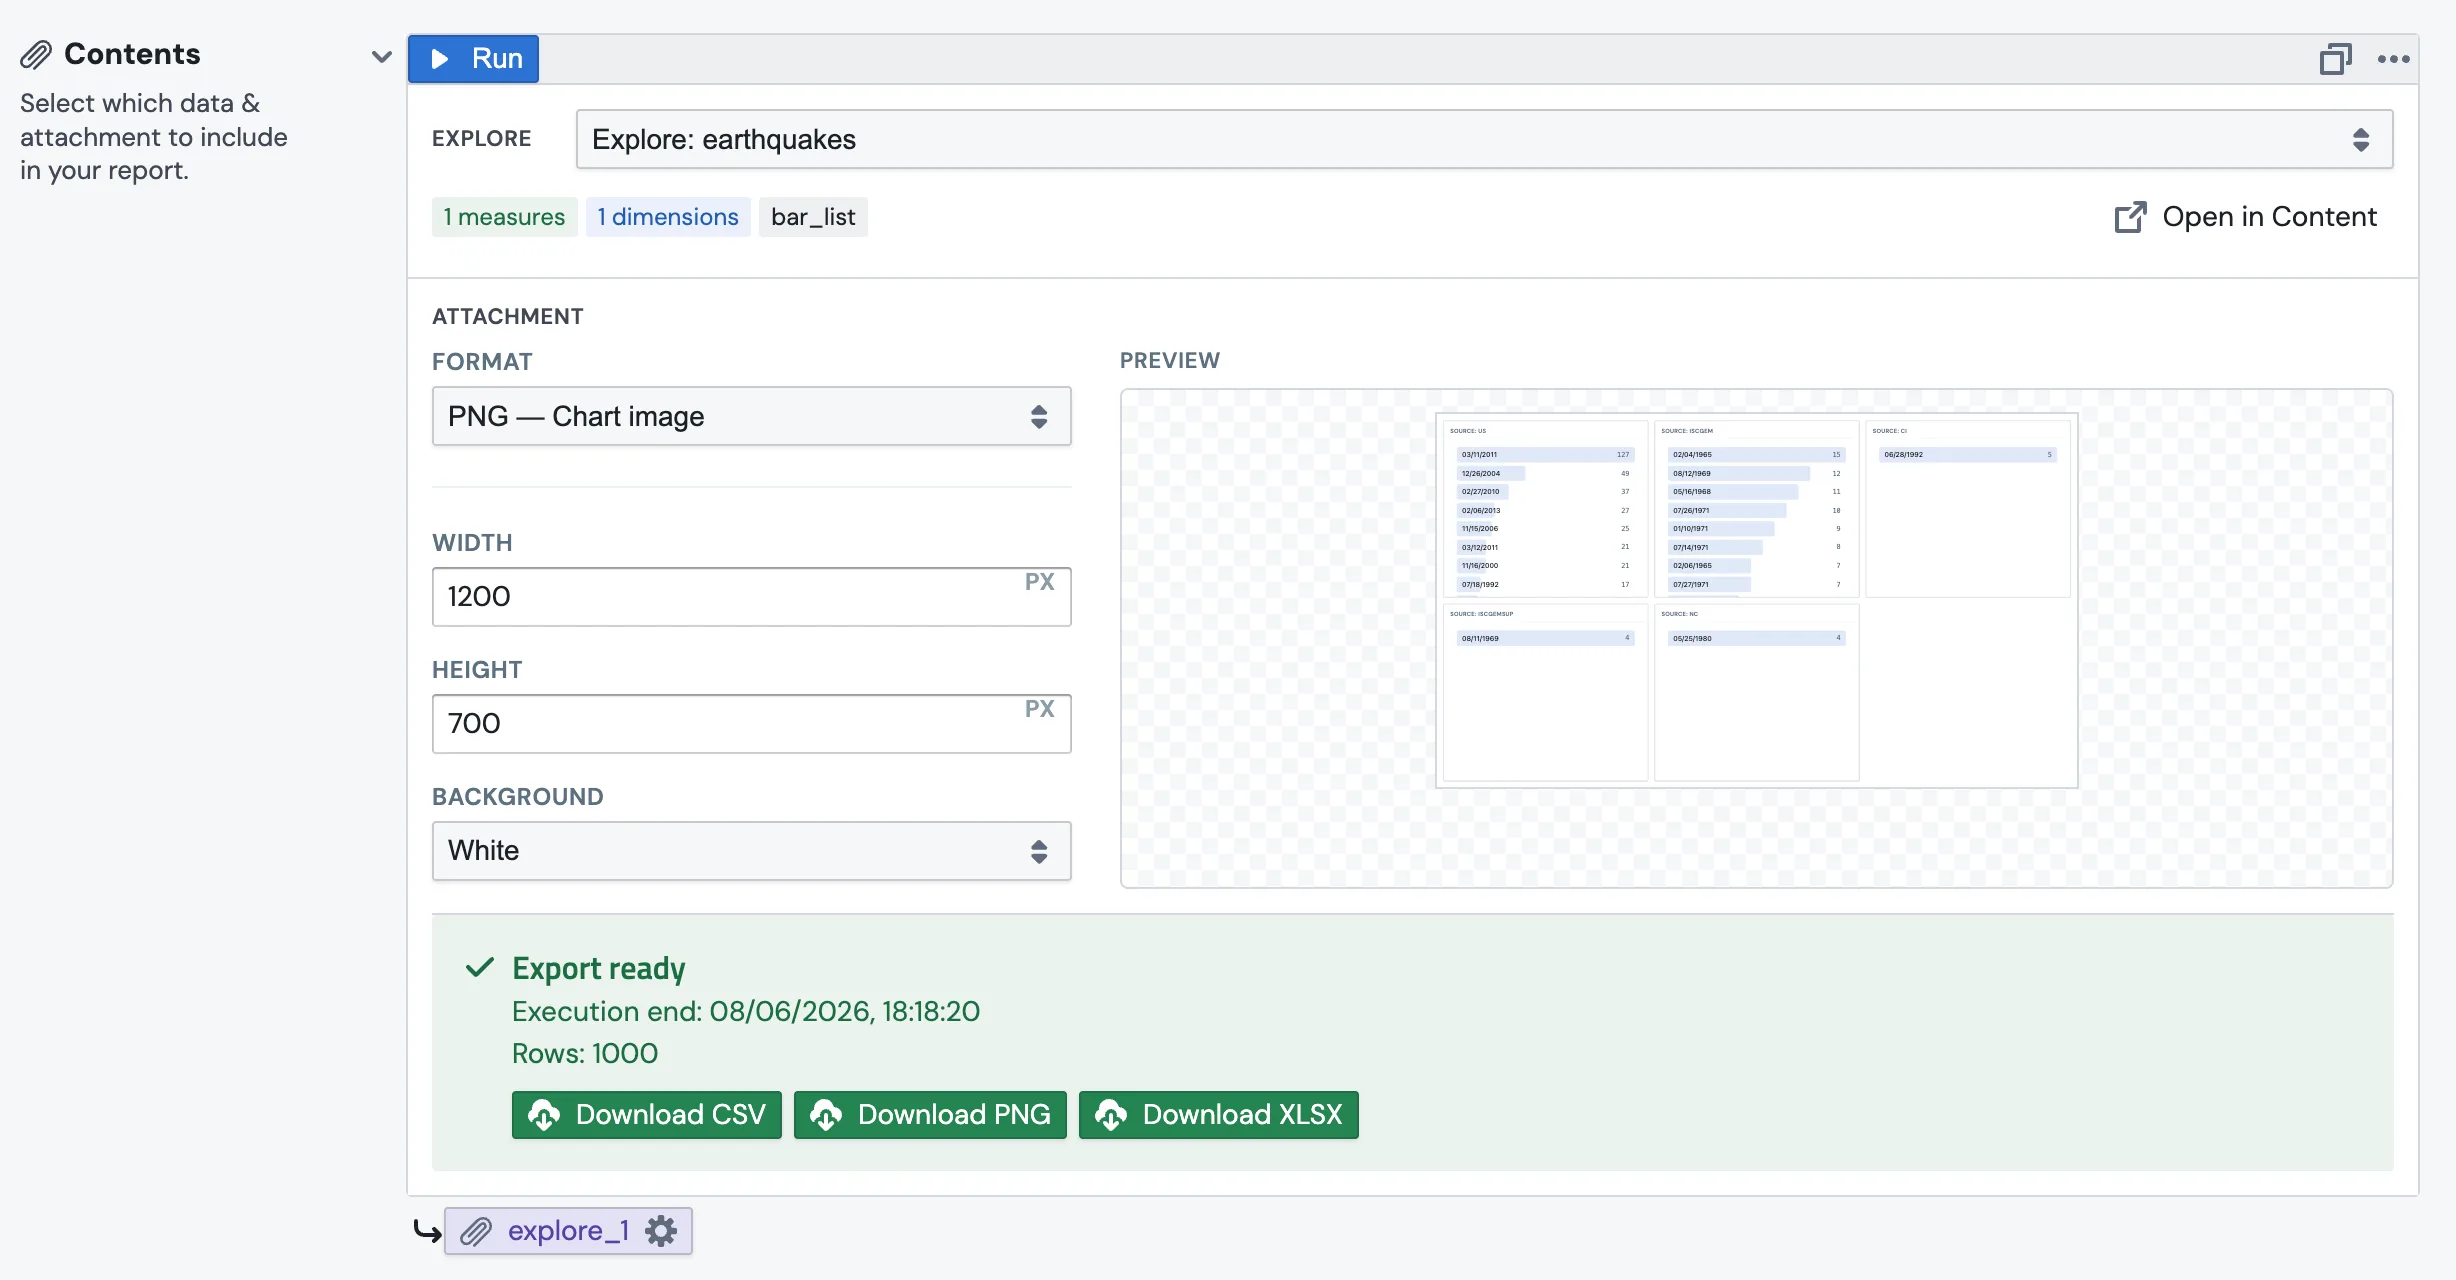
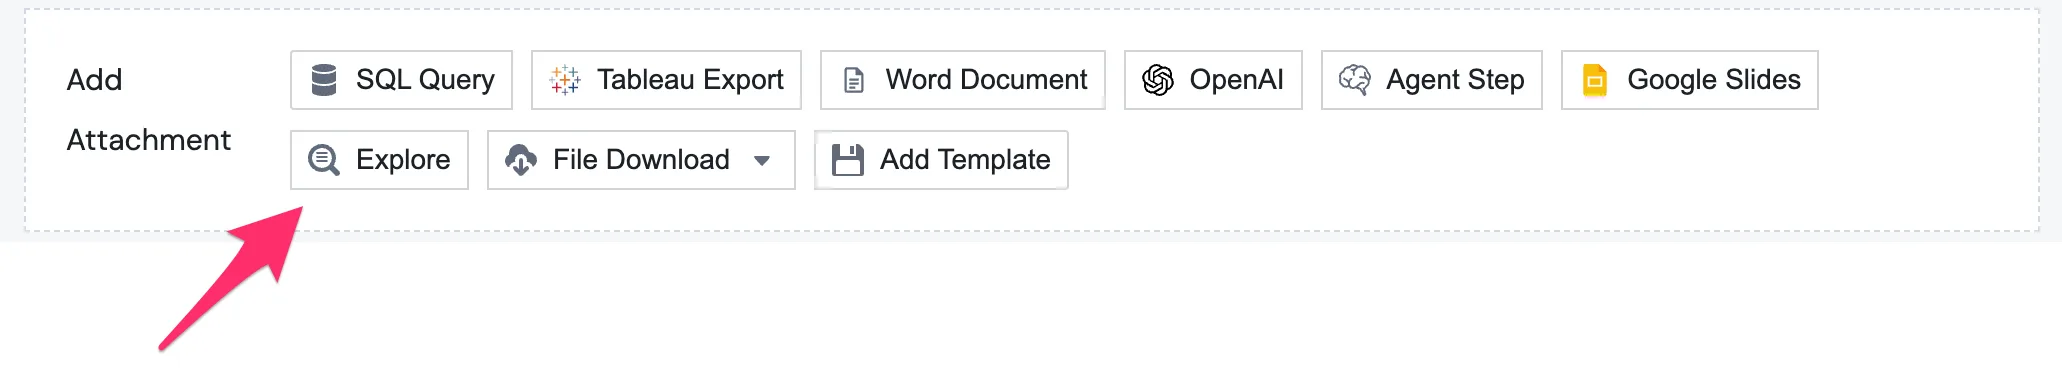
In Contents, click Add Attachment → Explore, then pick your saved Explore from the dropdown.
3
Under Attachment → Format, choose PNG — Chart image. Set the width, height, and background (white or transparent) however you like.
4
Click Run to generate the chart image and preview it.
🖼️
PNG is for sending; the live chart stays in Content. The report renders a fresh PNG from your Explore every time it runs, so the attachment always reflects the latest data. Use Open in Content from the attachment to jump back and edit the underlying Explore.
Send it to Slack
1
Add a Slack destination to the report and choose your channel.
2
Publish and run or schedule the report.
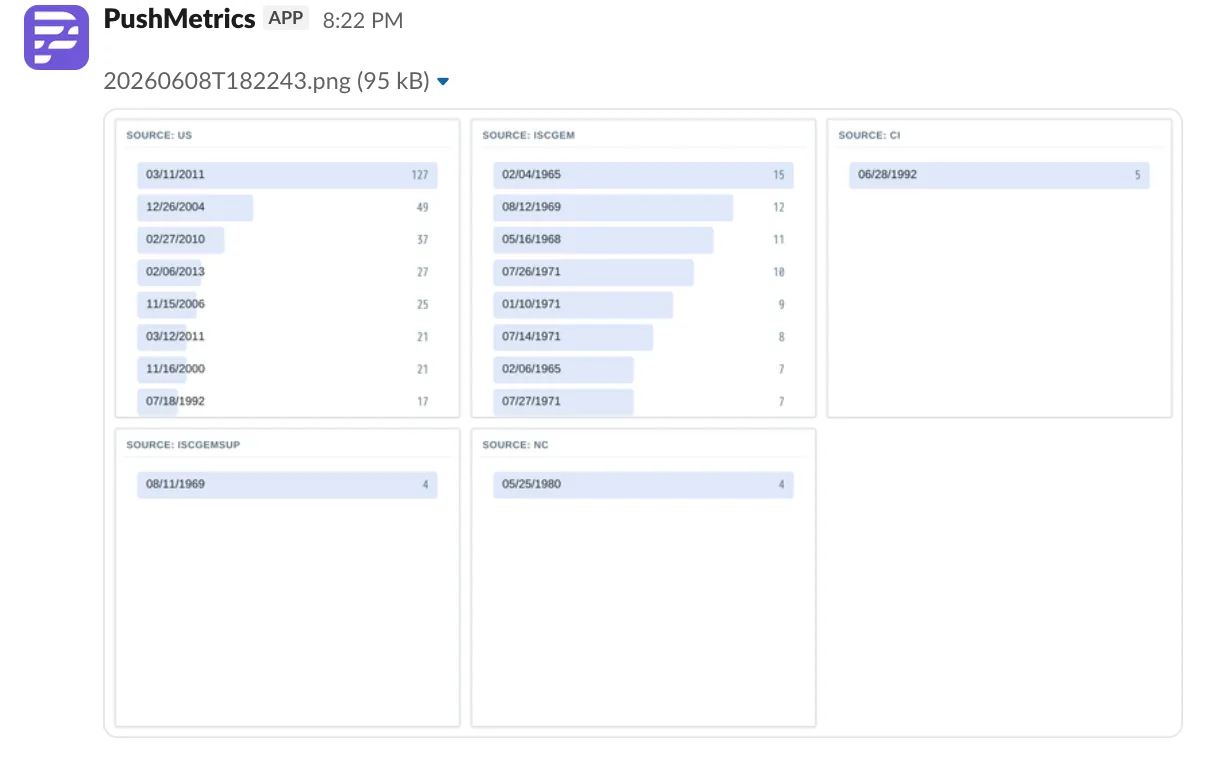
The PushMetrics bot posts the chart image straight into the channel.
⚠️
Before your first Slack chart, check two things: (1) Reconnect Slack so the integration has image-upload permission, and (2) make sure the PushMetrics bot is invited to the channel you're posting to. Charts won't appear without both.
Other destinations and formats
The same attachment works for any report destination, including email, webhook, and SFTP. The Explore can also be exported as PDF, CSV, or XLSX instead of PNG if you'd rather send a document or the raw data. See the reports documentation for the full list of destinations and scheduling options.
The full workflow
- Create a Metric Block, your reusable data source.
- Build an Explore, the query and the chart.
- Attach it to a report (this page) and deliver it to Slack, email, or beyond.