With PushMetrics, you can generate Word documents (.docx) by rendering dynamic content into a document template. This is perfect for creating formatted reports, invoices, contracts, and other documents that need a professional layout with data-driven content.

{{ }} will be replaced with data from your workflow at execution time. You can reference upstream task results using the References dropdown in the toolbar.How It Works
The Render block combines a rich text editor with Jinja templating to produce .docx files:
- Write your document content directly in the block's rich text editor, using formatting tools (bold, italic, lists, tables, headings, etc.).
- Insert dynamic data using
{{ }}Jinja tags that reference upstream task results. - At execution time, PushMetrics renders the template with live data and produces a finished
.docxfile.
The generated document is available as an attachment (referenced as docx_1) that can be delivered via Email, Slack, Google Drive, SFTP, or any other output block.
Creating a Render Task
Add a Render block to your notebook from the Add Block Menu. The block is identified by the {{ }} icon.
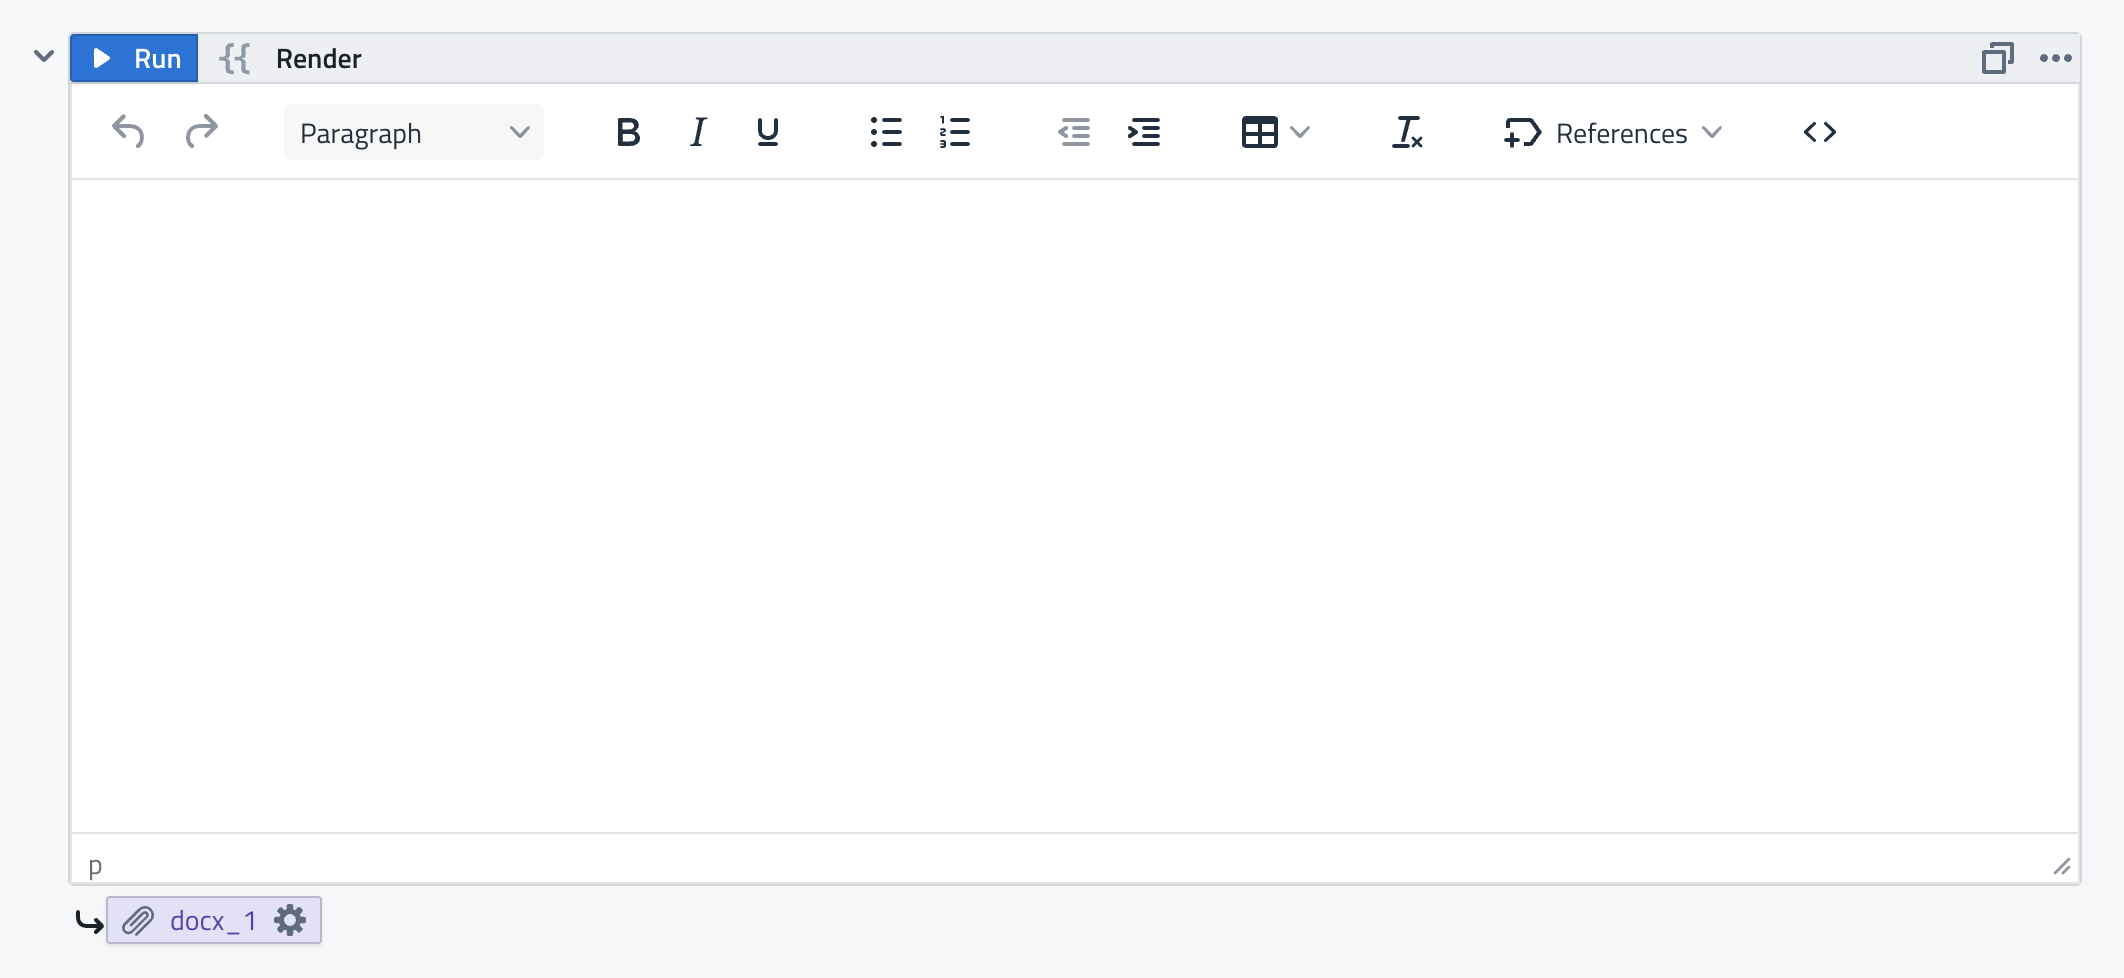
The Render block provides:
- Rich text editor — a full WYSIWYG editor with formatting toolbar including:
- Paragraph styles (headings, blockquotes)
- Text formatting (bold, italic, underline)
- Lists (ordered, unordered)
- Tables
- Text alignment
- Clear formatting
- References dropdown — quickly insert references to upstream task data (e.g., SQL query results, API responses, parameters).
- Code view
<>— switch to HTML source view for advanced editing. - Attachment output — the generated
.docxfile is available asdocx_1for downstream tasks.
Using Dynamic Data
Simple Variables
Use {{ }} tags to insert values from upstream tasks:
Dear {{ query_1.data[0].client_name }},

Your account summary for {{ query_1.data[0].report_month }}:

Total Revenue: ${{ query_1.data[0].total_revenue }}
Active Users: {{ query_1.data[0].active_users }}
Use the References dropdown in the toolbar to browse available data and insert references without typing them manually.
Tables with Row Iteration
To populate a table with multiple rows from a query result, use Jinja for loop tags:
{% for row in query_1.data %}
{{ row.name }} | {{ row.region }} | {{ row.revenue }}
{% endfor %}
Conditional Content
Use {% if %} tags to show or hide sections based on data:
{% if query_1.data[0].total_revenue > 100000 %}
Congratulations! You've exceeded your revenue target this quarter.
{% else %}
Your revenue target is within reach. Keep pushing!
{% endif %}
Delivering the Generated Document
The Render block produces a .docx file available as docx_1. Use it as an attachment in downstream tasks:
- Email — attach the document to an email using
.export() - Slack — upload the document to a Slack channel
- Google Drive — save to a shared folder
- SFTP — deliver to a remote server
Use Cases
- Client reports — generate branded, formatted reports with each client's data and deliver via email.
- Invoices — create invoices from SQL data with proper formatting and line items.
- Contracts and proposals — merge customer-specific details into standardized document templates.
- Compliance documents — produce regulatory reports with consistent formatting and dynamic data.
- Mail merge — combine with Report Personalization to generate one document per recipient.
Tips
- Use the References dropdown to insert data references without remembering exact syntax.
- Switch to code view
<>for fine-grained control over the HTML structure. - Test your template with a manual run before scheduling to verify that all tags resolve correctly.
- Use Jinja filters for formatting:
{{ revenue | round(2) }},{{ date | default('N/A') }}.