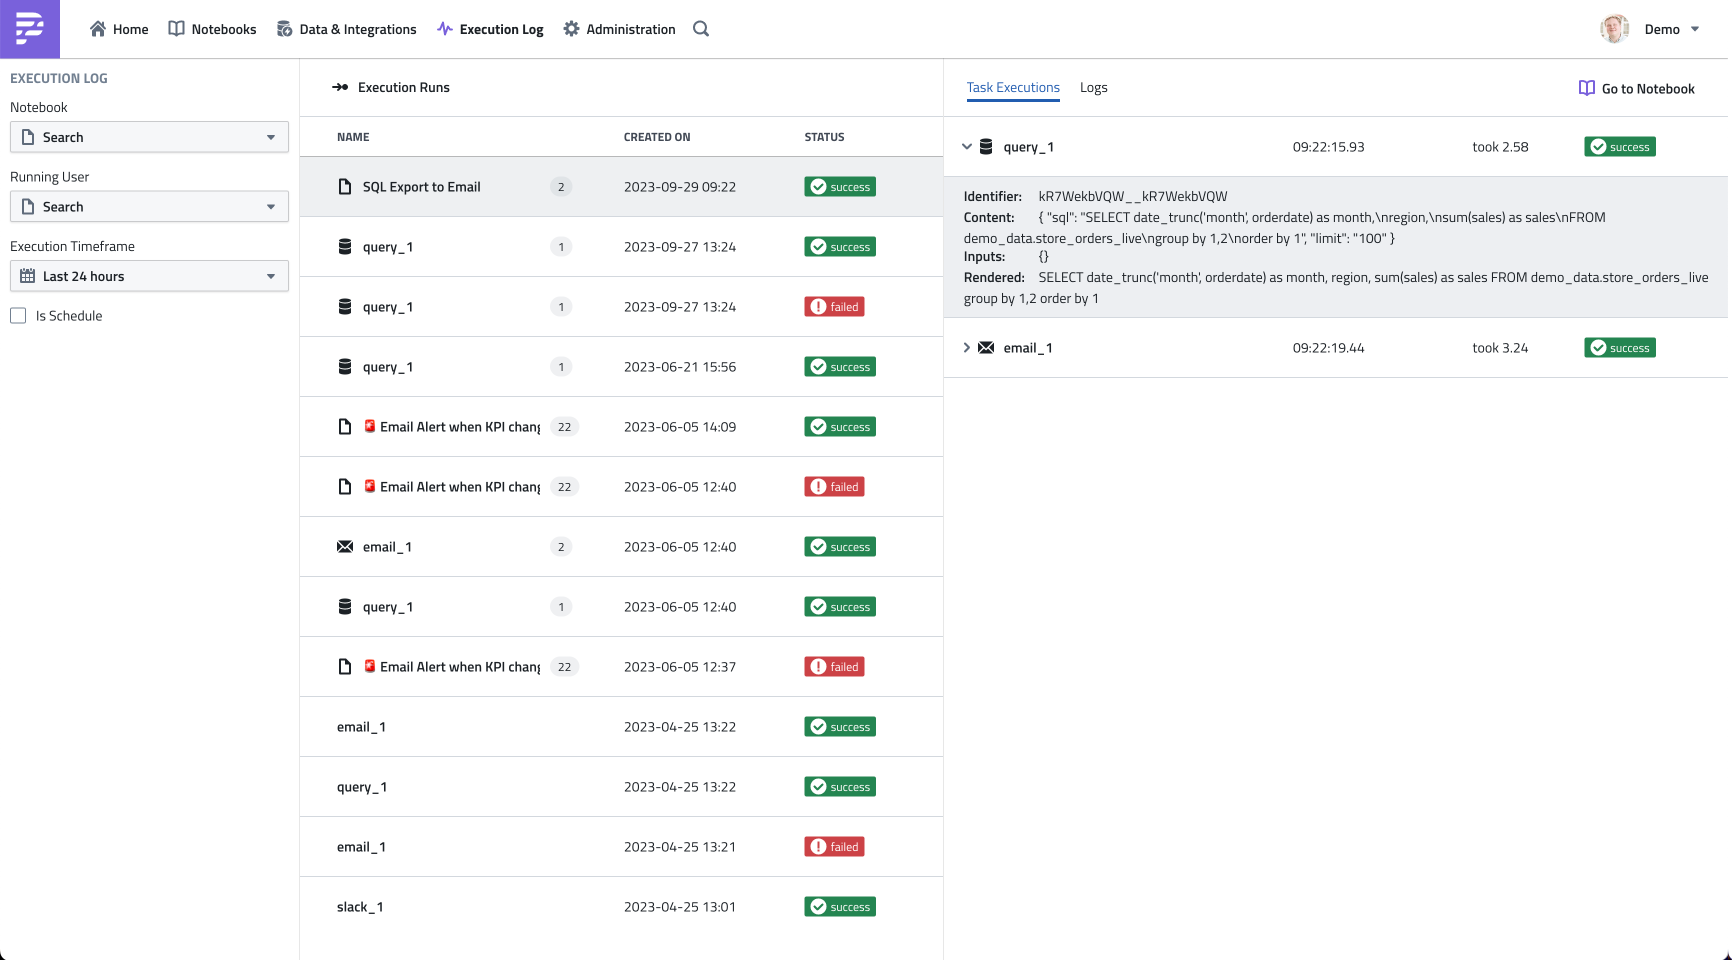
In the Execution Log you can find all the details about past runs of your notebooks and individual tasks.
It is a helpful tool to understand what has been run and to debug problems.
Filters
On the left sidebar, you can filter the log for specific Notebooks, Users or timeframes.
You can also filter to only show scheduled runs.
Execution Runs
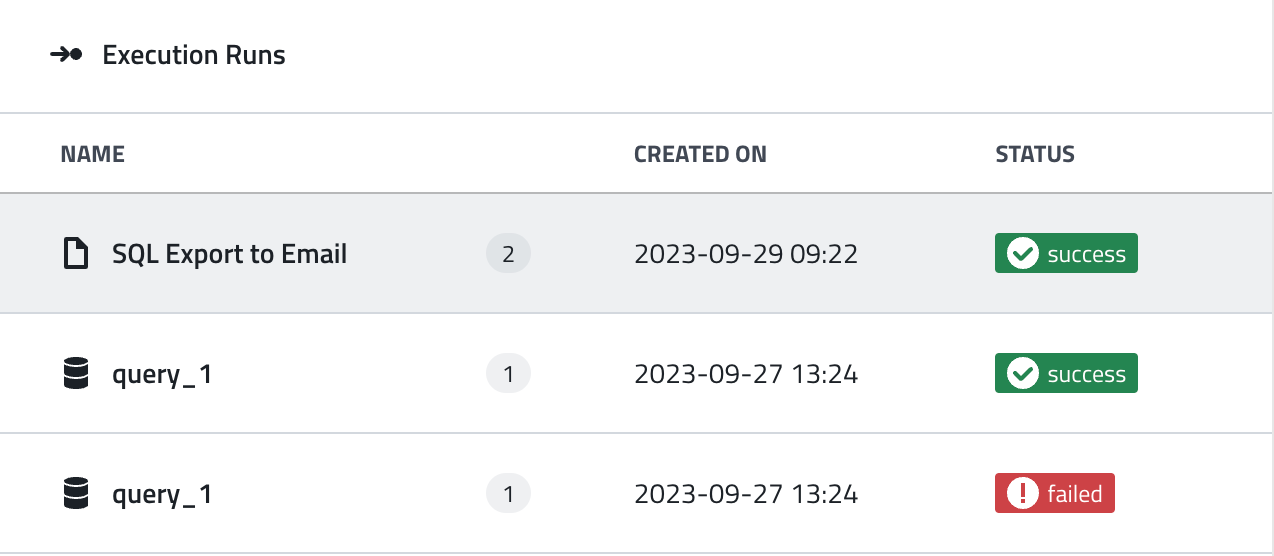
In the center, it shows the list of execution runs, which are either executions of an entire page of of individual tasks.
You can see the name and type of the run, the number of tasks it contains, when it started, and it's final status
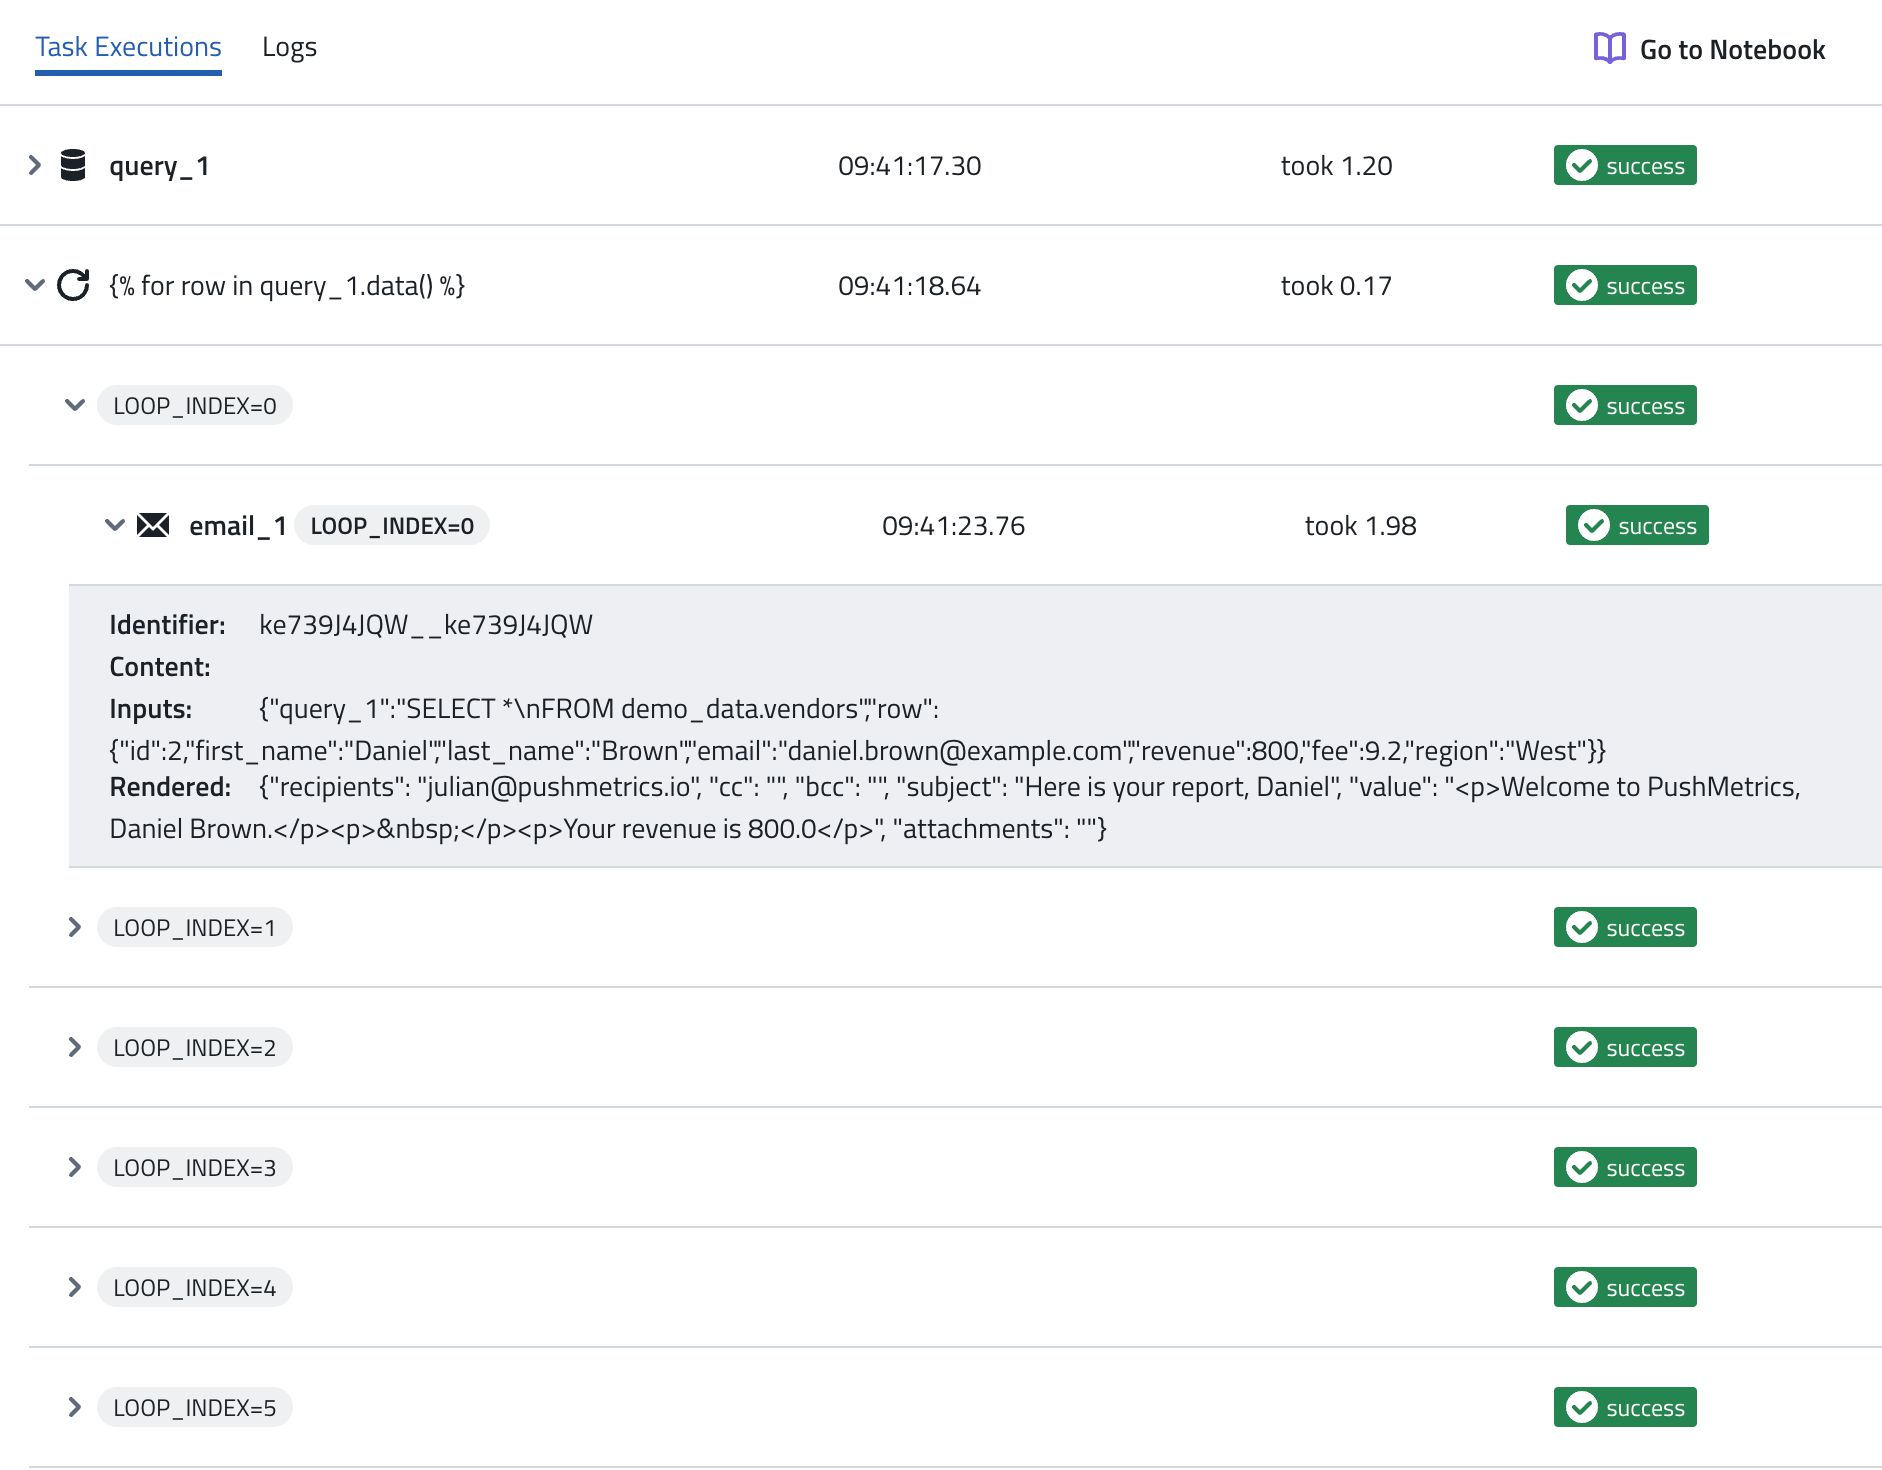
Task Executions
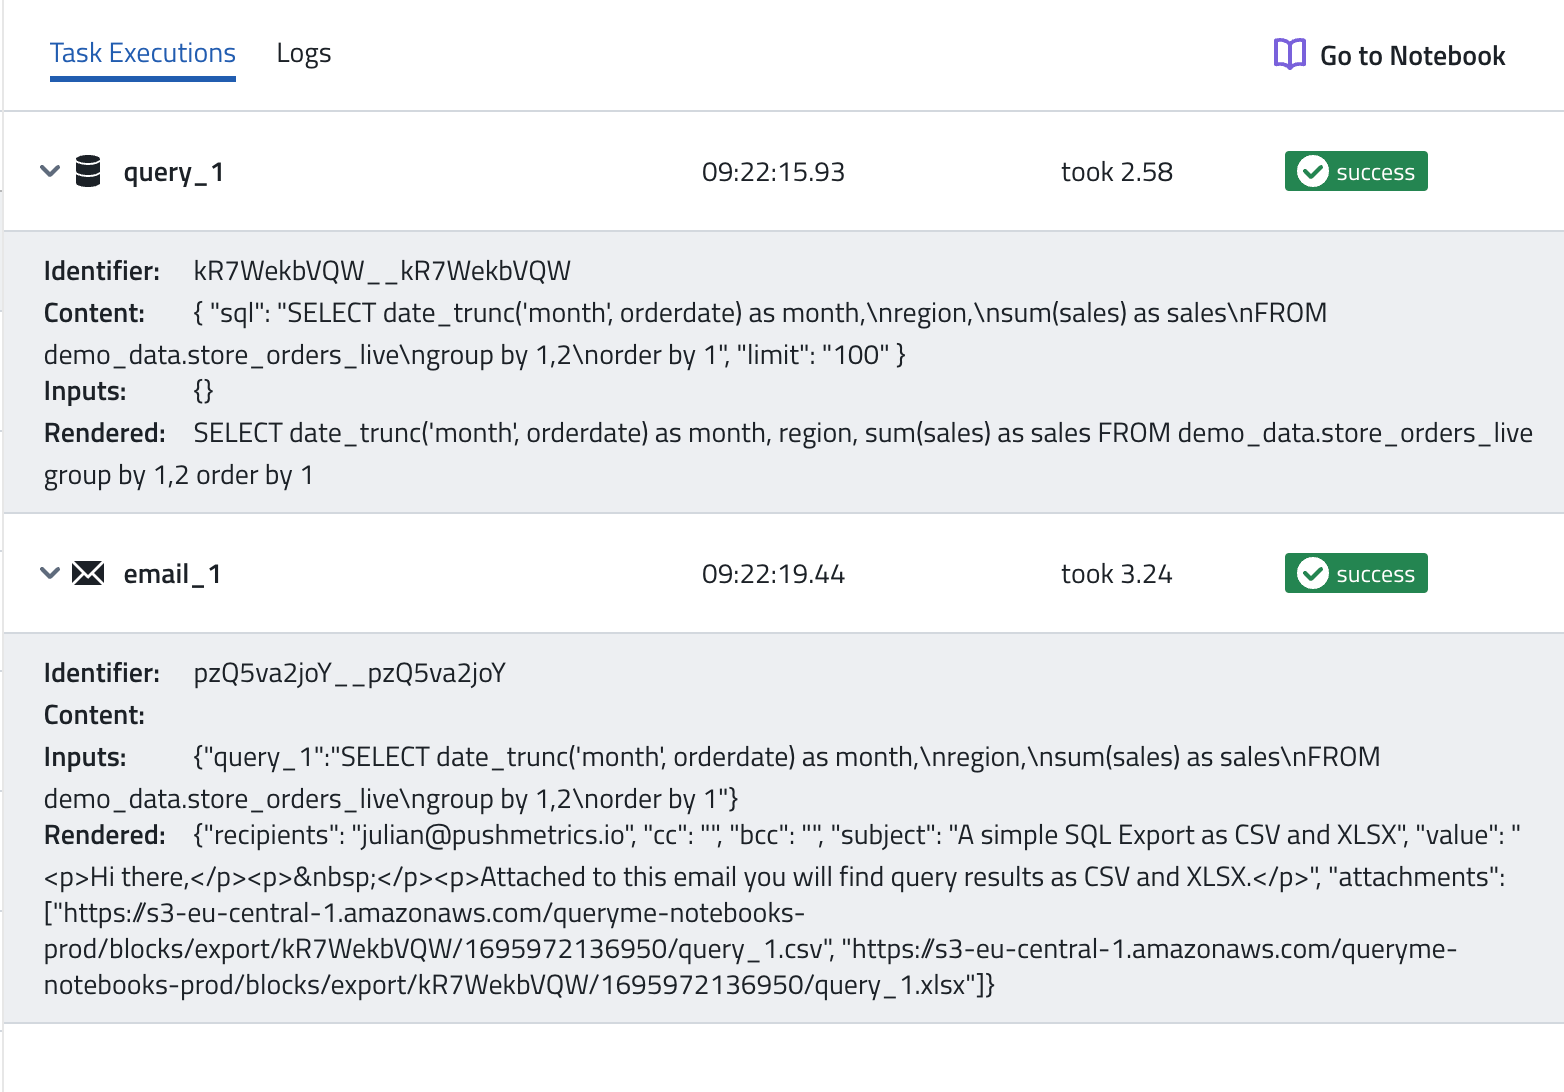
Shows a list of all the individual tasks that were executed in the run.
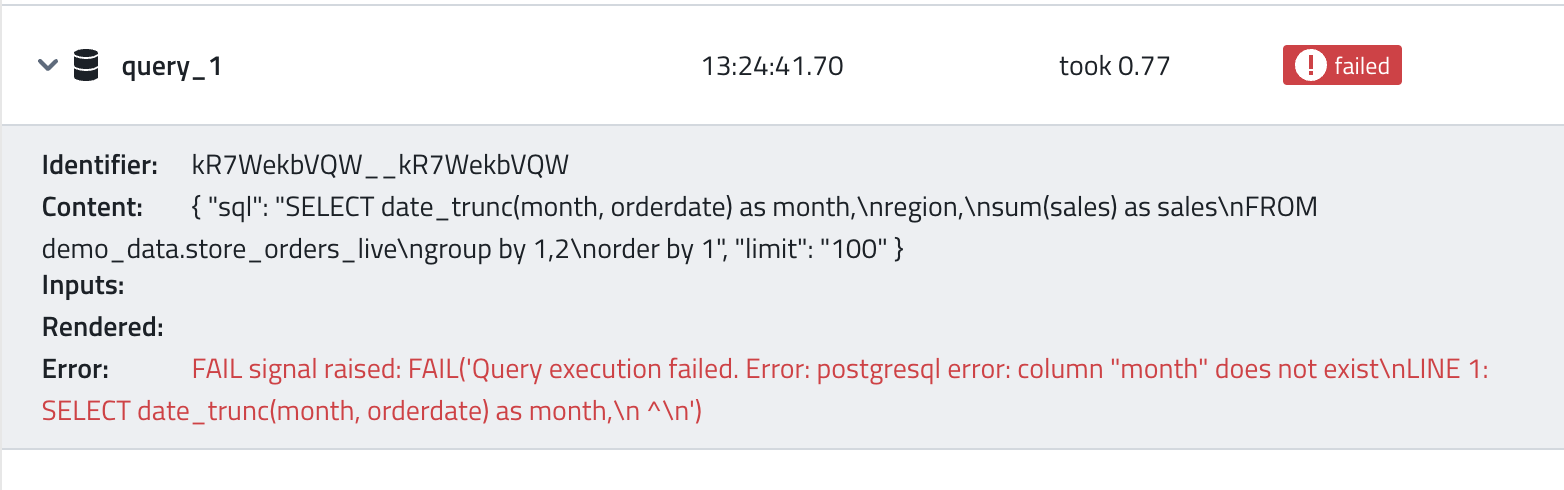
For each tasks, you can see the content of the task, the inputs (dependencies from other tasks), and the rendered output.
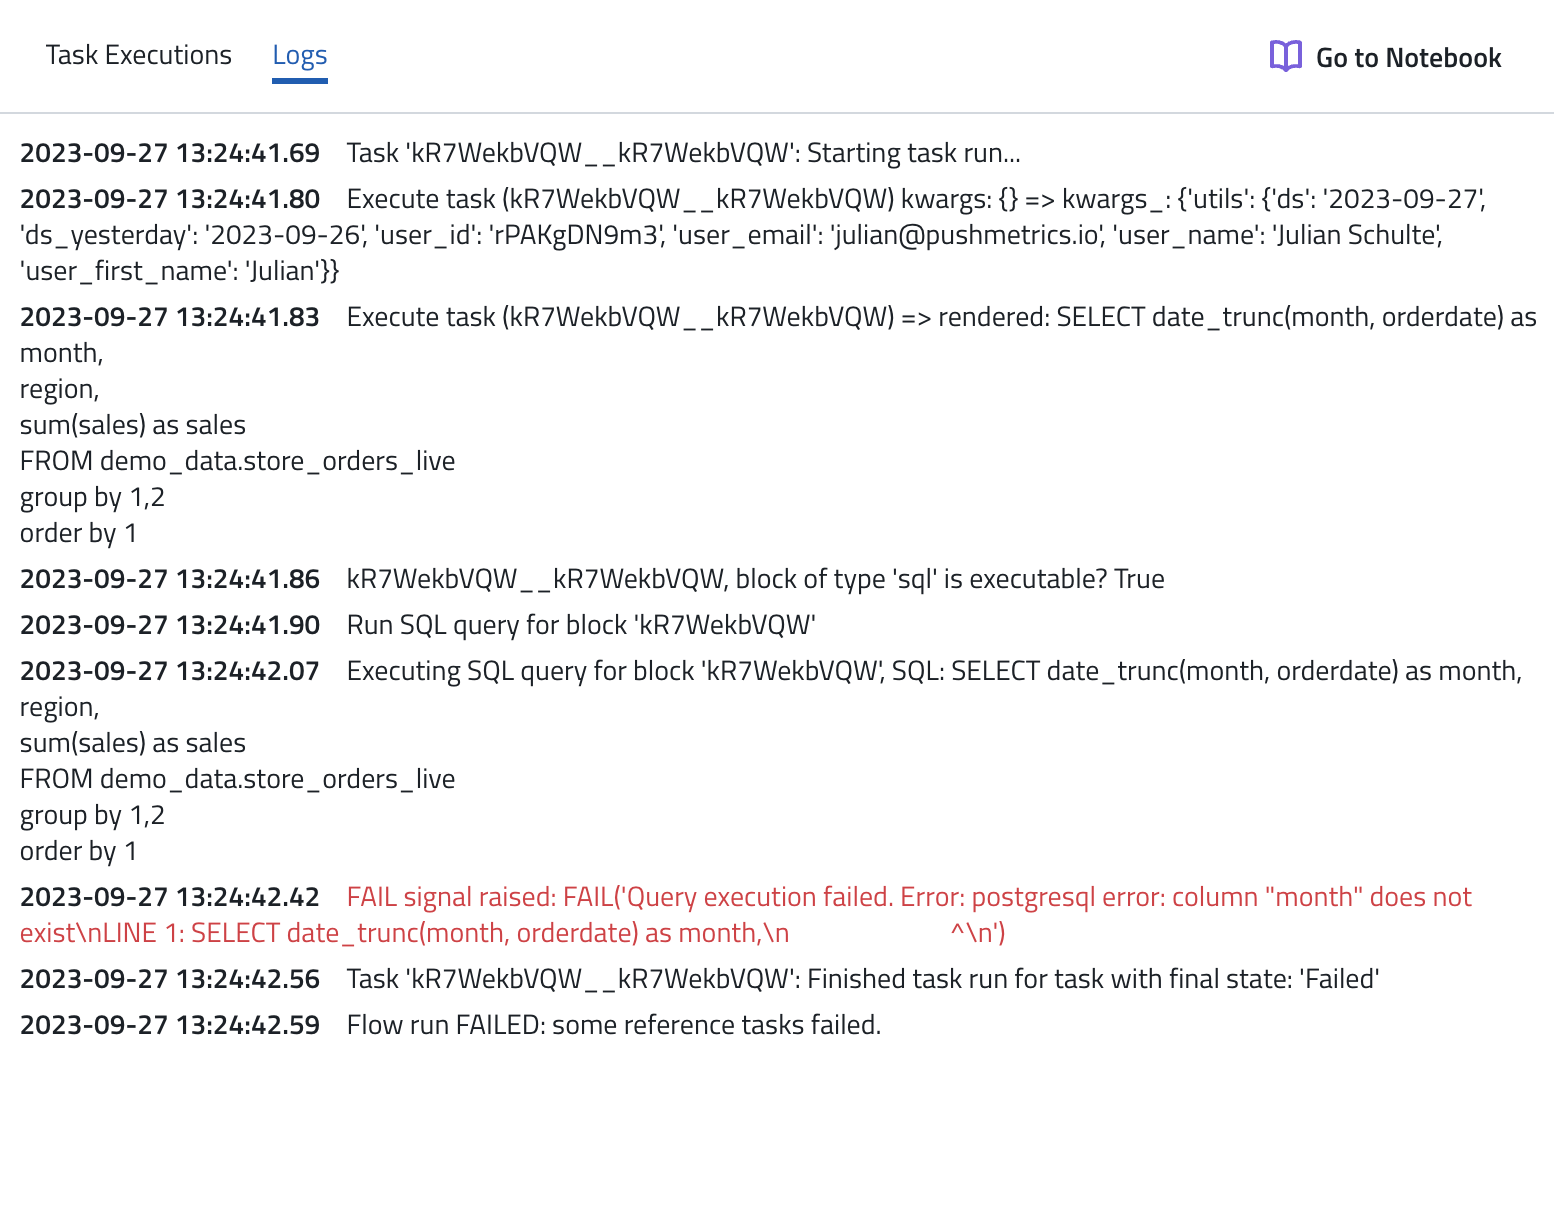
If something went wrong, it will show you the error message:
It can also show you the logical structure and how IF/ELSE conditions and FOR LOOPs are being evaluated:
Re-running Failed Executions
If a run fails — whether due to a temporary database issue, a network timeout, or a transient API error — you can re-run it directly from the Execution Log without navigating back to the notebook.
To re-run a failed execution:
- Open the failed run in the Execution Log.
- Click the Re-run button.
- PushMetrics will start a new execution of the same notebook or task with the same configuration.
This is especially useful for:
- Transient failures — retry after a temporary database or API outage.
- Scheduled runs — re-run a failed scheduled execution without waiting for the next schedule.
- Debugging — after fixing an issue, re-run to verify the fix.
Logs
To debug issues, it is sometimes helpful to inspect the full log of a run, which you can do on the Logs tab